While many online retailers know that shopping cart abandonment is part of the business, not every retailer will experience the same abandonment rate. Since the first step in solving any problem is understanding it, let’s see how we can measure the shopping cart abandonment rate in Google Analytics.
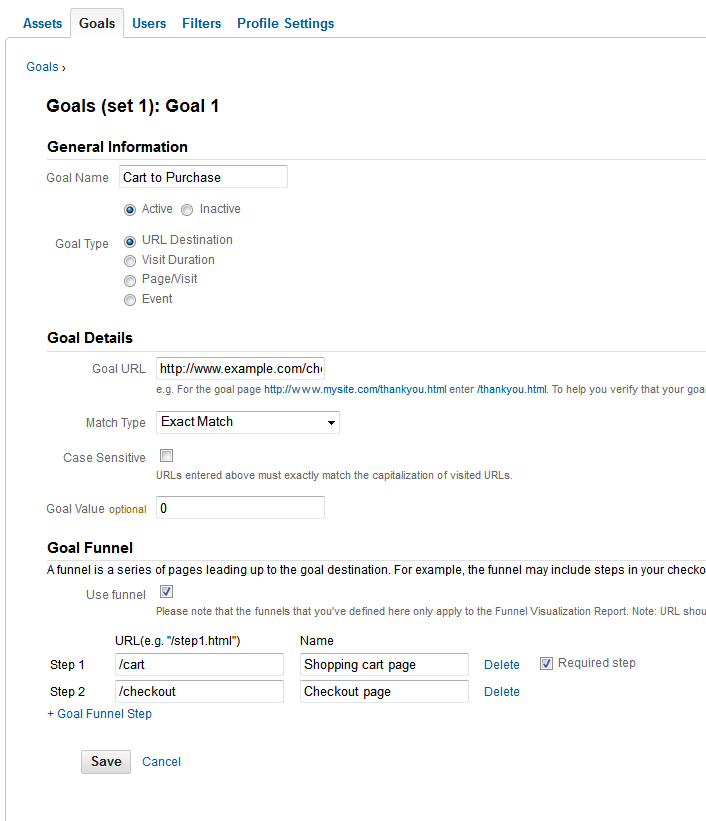
Google Analytics needs no introduction. This extremely powerful tool is used by over 10 million websites and is invaluable for analyzing and making the right marketing decisions. To measure the abandonment rate, we will make use of two advanced features: Goals and Funnel. Goals allow you to define and track conversion rates for various objectives. An objective can be anything: a visit to a certain page, filling and submitting a form or staying on the site for a certain period of time. A Funnel is the path a visitor is expected to take on his way to completing the goal. With these two terms defined you can probably already guess how we will set this up: our Goal will be the order confirmation page and the funnel will be the list of URLs a visitor must go through after adding an item to the shopping cart. In most ecommerce platforms, when an item is added to the cart, the user is automatically redirected to the cart page so the cart page will be our starting point followed by the checkout page. Note: To set up goals, you must be an administrator of the Analytics account 1. Click on admin, select your profile and the click on the Goals tab  2. Enter a descriptive name for the Goal, we’ll call ours “Cart to Purchase” 3. In Goal type select URL Destination and enter the URL of your order confirmation page. This page is typically accessed only when an order is completed 4. Click the Use funnel checkbox to add the necessary steps to complete an order. In the screenshot below you can see that I added the cart page as step one and the checkout page as step two. 5. Save your Goal .
 And that’s it! Depending on the amount of traffic on your site, it could take anywhere between a couple of hours to a couple of days to see meaningful data. How can we tell the shopping cart abandonment rate? Using the Funnel Visualization page.
  This report contains a lot of interesting data but the one we care about is the abandonment rate. We can see that in our sample data we have a 43.66% funnel conversion rate which means that our abandonment rate is 56.34%.
Go out and conquer the abandonment rate!
The post How to measure shopping cart abandonment rate in Google Analytics appeared first on Barilliance.
