Quantcast
Channel: Barilliance
Viewing all 254 articles
Browse latest View live

Client Retention Strategies/Tools That Work The Best

$
0
0

Retention marketing is a rising topic in the e-commerce community for being extremely vital and profitable.

Its importance can be summarized with the famous statistic by Bain & Co. – a 5% increase in customer retention can increase profitability by 75%.

Indeed, retaining more clients increases the repeat purchase rate, average order value, conversion rate, ROI, customer lifetime value and long term profitability.

So what can you do to achieve all of these?

There are many retention strategies that you can implement. In the core of each strategy is the goal of keeping customers happy, repurchasing and loyal.

This aim is achieved by establishing and maintaining a relationship with those customers, by continually engaging with them and creating a relevant and valuable experience.

Read this article to find out what the client retention strategies that work the best are and how exactly you can implement them.


  1. Exceed your customers’ expectations

What is worst than unhappy customers? Disappointed customers.

If you’ve ever heard the sentence “I’m not mad, I’m disappointed” I’m sure you understand the severity of this feeling.

Once customers have expectations, if they are not met, they will be disappointed. According to InReality, only 16% of shoppers would give a site a second chance after a poor experience and BI Intelligence estimates it takes 12 positive customer experiences to negate the impression after 1 bad experience.

But, if there are no expectations, to begin with, the same customer will feel less bad about the same experience.

For this reason, you must set customer expectations early and lower than you can provide. This way, you have certainty that you will always (at least) reach customers’ expectations, perhaps even exceed them.

When you do measure up to the expectations, you secure happy and satisfied customers who may repeat purchase. When you exceed expectations, you acquire customers who are ecstatic about you and are likely to become loyal and repeat purchasers.

As Shannon Kohn from Datta said, “under promise and over deliver”. You will display integrity, consistency, and care, and seem as a brand that goes above and beyond.

Pragmatically, this could involve saying delivery is a week’s time but having the order arrive in 4 days. Another example is having a return policy of 2 weeks but if it took a customer 2 weeks and 4 days you will still allow the return. Simple things, big surprises, and much admiration.


  1. Provide excellent customer service

Oh customer service, the backbone of any company. If you want to retain your customers (and achieve point 1) this is a vital strategy.

According to BI Intelligence, a poor customer service experience caused 60% of customers to not complete a purchase and 24/7 found a day of it drove 47% of customers to competitors.

Accenture estimates that 52% of consumers have switched providers in the past year because of poor customer service, which is estimated to cost $1.6 trillion.

So how can you provide excellent customer service?

First of all, you must be forever attentive to your customers from their very first interaction with you. Never end the contact, even post-sale, continue to contact, help and engage your customers. This can make the difference between a satisfied and a retained customer.

Secondly, provide your customers multiple ways to contact you, so that it is easy for them to interact and get help from you. This includes an email address, a phone number, a live chat (crucial to 42% of consumers), social media accounts and any creative channel of communication you can think of.

Third, ensure to respond quickly.

Lastly, have a proactive customer service. This means that you don’t just help individuals, but you learn from their needs, issues, and complaints and improve these aspects. This improves your site, brand and customer service by preventing such issues from recurring as well as shows customers you care.

According to Apptentive, 97% of shoppers will become more loyal to a company that implements their feedback.


  1. Indulge in regular communication

Regular communication is essential for retention.

This involves emails, phone calls and letters about anything related to your business such as follow ups, cart abandonment emails, post-purchase confirmation emails, special offers and promotions, events and more. Continue to engage with the shopper even after they have purchased and even if they don’t go on-site anymore.

This strategy helps with client retention as: it reminds the shopper about the company, makes the company engaging, makes them feel important, provides them information and eliminates any doubts and fears (particularly after purchase).

However, don’t just engage with the customer for the sakes of engaging. Your contact must have a purpose and provide value to the customer. Otherwise, it isn’t engaging and the customer will not be interested.


  1. Use a retention/CRM platform

If you want to retain customers, you must need to know which customers to retain and how to communicate with them. This you can easily know with a retention platform.

A retention platform collects information with each interaction of each customer with the company (online and offline) and creates a 360 profile. The profile is composed of demographic information and tracked engagement with the site, which reveals the shopper’s needs, interests, preferences, and habits.

With this information, you can segment your customers to be able to target (via emails or phone calls) specific segments that are in need of communication to remain retained. Examples of segments include:

  • At-risk customers. Reactivate customers who have not purchased in a while just before you completely lose them. Remind them of your existence and ask them why they have stopped buying.
  • Valuable inactive customers. Reactivate customers who used to make big/frequent purchases, but haven’t purchased in X time.
  • Profitable customers. Reward your current profitable customers who have the highest returns, to encourage continuous purchasing and retention.
  • Abandoners. Send personalized offers to customers who put items in their carts and didn’t make a purchase.


Final thoughts

Following these client retention strategies will jumpstart your customer retention rate improvement. Remember to consistently monitor the rate to know the effect of your strategy.

The post Client Retention Strategies/Tools That Work The Best appeared first on Barilliance.


4 Retention Tactics/ Tools You Can Implement Right Now!

$
0
0


Retention marketing is the marketing strategy which focuses on the existing customer base. The strategy aims to make them repeat customers by nurturing the relationship and keeping them happy, engaged and loyal.

Retention marketing is essential for increasing your long term profitability.

The more customers you retain, the higher your conversion rate, ROI and customer lifetime value are.

There are numerous strategies and tactics to retaining more customers. They mostly revolve around the idea of continuous, personalized communication and keeping customers satisfied and loyal.

In this article, we share tactics and tools you can implement right now to increase your retention abilities.


  1. Reviews

Customer input is extremely important for creating social proof for your company. Shoppers care about other shoppers’ actions and opinions as, unlike the company, shoppers’ advocacy is perceived as unbiased and objective.

Therefore, you should allow and encourage customer reviews for your products and the company as a whole.

Pay attention to negative reviews. Reply to the negative reviews, asking what is wrong or showing your intent of correcting the wrongdoing. If it is possible to fix the issue for the individual and to fix it in general – do so and thank the reviewer for their help in improving your site.

Your customers will see that you are – about their opinions and their experience – and that you are proactive in creating the best experience for them.


  1. Surveys and Questionnaires

Similarly to reviews, surveys and questionnaires are there for you to improve your services and at the same time to engage with the shoppers and show them how much you care.

Use surveys and questionnaires to receive more in-depth individual feedback than reviews from shoppers.

This can help you find out:

  • What your strong and weak points are in the customers’ eyes.
  • Any issues you need to fix.
  • How you are performing compared to the shoppers’ expectations. Reaching (or even better- exceeding) expectations is crucial.

Track your feedback so you can see changes and improvements over time.


  1. Social Media

Social media is another channel of communication where you can engage with your customers. Use this space to connect with your customers and create personal, unique relationships.

So what exactly should you do?

First, create a social media profile on media such as Facebook, Twitter, Instagram, Linkedin and Pinterest.

Include links to all of these profiles each time you communicate with a customer (on-site, in emails, etc.) and include a link to your website in each of your social media profiles.

Be active on social media. Post related photos, share articles about your company (blog posts, case studies, your products or services), share related articles to your industry and engage with consumers who engage with you (consumers who comment, retweet, etc.).

Social media is a place where shoppers browse in their free time, therefore you should be fun, engaging and interesting on these channels rather than sales-oriented.

Additionally, encourage your shoppers to use social media to share their experiences with the company, making them brand advocates, such as: posting on your wall, sharing products on their wall, etc.


  1. Post-Purchase Email

If you want your customers to be one-timers then after the customer made a purchase you needn’t interact with them. However, if you want loyal, retained customers, your nurturing continues way past the purchase.

The first step of engaging with the customer post-purchase is with a post-purchase email. This is usually a transaction confirmation email that confirms the purchase details and ensures the customer the transaction is done and the order is on its way.

Beyond this information, you could include aspects of the email that nurtures the relationship.

Include a “thank you” somewhere in the email to show the shopper you are grateful and to ensure them that they made the right choice.

Provide them post-purchase care to show them they are not alone and have support if anything goes wrong. Provide them with contact information (email address, phone number, social media profiles, live chat, etc.) and encourage them to use it.

Let your excellent customer service shine to create a great customer experience and therefore satisfaction and retention.


These 4 retention tactics are great to implement quickly to kickstart your retention work. After these 4 simple, yet big, changes are implemented, continue to implementing more complex, long-term strategies.

The post 4 Retention Tactics/ Tools You Can Implement Right Now! appeared first on Barilliance.

Psychographic Segmentation

$
0
0

Personalization is key to conversion optimization.

It is clinically proven that personal interactions matter. The question is, how accurate and relevant can we get our offers. Can we do more than gauge intent through age or location? Is it possible to tap into the true emotional drivers of purchase?

Investing in psychographic segmentation will uncover the true reasons customers buy from you. It will dramatically change how you communicate, educate, motivate, and ultimately compel your customers to action.

In this article, we will break down what psychographic segmentation is, possible options for your store to use.

What is psychographic segmentation?

Psychographic Segmentation
Image source

In "Marketing Strategy", O.C. Ferrell and Michael Hartline explain that psychographic segmentation "deals with state-of-mind issues such as motives, attitudes, opinions, values, lifestyles, interests, and personality."

Other segmentation techniques, such as demographics, deal with outward physical traits. Example variables include location, gender, and age.

In short, demographics deal with the quantitative. Psychographics deal with the qualitative. In other words, demographics deal with who you are. Psychographics deal with what you want, and why you want it.

As marketers, we want to understand our customer’s psychographics. In the past, the only way to do this was through proxy.

In the past, we used demographics because is was the best indicator we had.

That’s changed.

Tracking technology and website behavior allow us to create metrics that are much more powerful than demographic data like age.

How to Use Psychographic Segmentation Variables in Your Store

Over the years, numerous methods have been developed to help companies understand psychographics.

Because of this, there is some overlap between the variables used. However, it is still helpful to look at all methods.

Each one asks you to view your customer in a slightly different way. Ultimately, one method may prove more insightful for others for your particular industry and product.

Let’s begin.

According to MBA Skool, there are six major sources of information to consider.

Activities

What actions do your customers make? Activities can range from what your customers do at work, to hobbies, club memberships or even social events. Less frequent activities can be equally strong signals -- such as vacations and entertainment decisions.

Interests

What things do your customers care about? Interests can include societal dimensions (such as family, home life, work life, and community) to product categories such as fashion, hardware, or food items.

Opinions

What positive or negative associations do your customers have regarding themselves, social issues, your business, industry, or even specific products?

Lifestyle

How does your customer act on a daily basis? As Louis E. Boone and David L. Kurtz explain, “Lifestyle segmentation typically encompasses other psychographic factors and compiles them under one name.” These factors income a customer's motives, perceptions, and attitudes along with a hard look at what influences a customer on a regular basis (such as family dynamics and cultural aspects).

Personality Traits

There are a variety of personality segments eCommerce stores use.

One of the most popular personality tests used is the Myers Briggs, which segments people across 16 specific personality types.

While diving into the fundamentals of Myers Briggs is outside the scope of this article, it is helpful to explore the test at a high level to illustrate how personality tests are done.

A Myers Briggs’ test looks at four major questions.

  1. Where do you focus your attention? Do you focus more on the outer world, or do you prefer to focus on the inner world? (Extraversion or Introversion)
  2. How do you take in information? Do you focus on external stimuli, or do you prefer to interpret outside information for meaning? (Sensing or Intuition)
  3. How you make decisions? Do you rely on logic or do you look to individual people and circumstance? (Thinking or Feeling)
  4. Finally, how you deal with the world? Do you tend to set things in stone, or do you want to keep things open to new options? (Judging or Perceiving)

Values and Attitudes

One popular method to identify the values and attitudes of your customers is called "Values and Lifestyles Research". Values and Lifestyles Research was developed by Arnold Mitchell. It is based on Maslow's hierarchy of needs. As this article explains, there are three primary motivations to explain a consumer's attitude.

  • Ideals - your customers base their buying decisions on knowledge and principles.
  • Achievement - your customers base their buying decision based on what their peers see as successful
  • Self-expression - your customers base their buying decision based on their personal desires for activity and interaction

Psychographic Segmentation with VALS
Image source

Learn How to Lower CAC and Increase Profits with Psychographic Segmentation

Ok. We know psychographics are important. We also know a variety of dimensions we could use.

Now, how do we put it all together and benefit our stores?

To illustrate, we collected a case study in the financial industry currently using psychographic segmentation to improve marketing ROI.

Case Study: How Leaders Credit Union Uses Psychographics to Increase Conversions

Leaders Credit Union analyzes past purchases to understand spending habits of its members. Leaders Credit Union uses this information to chart each customer's buying stage.

As Josh McAfee, Vice President of Marketing, explains, "When prospecting for new accounts in our external markets, we use Fiserv Bank Intelligence to narrow our focus...uses P$YCLE segmentation presented by Nielsen, along with census data to paint as accurate a psychographic picture of the target customer as possible."

Leaders Credit Union creates highly relevant, powerful call to actions based on this psychographic segmentation. For example, one psychographic segmentation they have identified is what they call the "payoff stage". These customers are in the process of paying down debt.

So far, the most successful offer for this psychographic is related to low interest rates.

CUES, an education platform dedicated to developing credit union CEOs, shows how psychographics can multiply a Credit Union's conversions.

"Well-defined digital consumer personas and profiles help a credit union lower the total cost of acquisition for new members while increasing product adoption and overall profitability of current members.

Imagine how many loans and new accounts credit unions could close if they knew which members were shopping for cars this month, or if they knew the kinds of cars members prefer. Think about the increased number of products or services a credit union could effectively offer to a member as part of an on-boarding or cross-selling process if they knew more about each new member's life.”

Next Steps

Personal offers work.

Personal offers require accurate, data driven segmentation. Tools like Barilliance give you the power to segment customers on a much deeper level than demographic data.

The post Psychographic Segmentation appeared first on Barilliance.

Product Recommendation Effect on Black Friday Weekend

$
0
0

Black Friday weekend is the most important sales weekend for many eCommerce stores.

Many invest in technology to help bolster sales. This year, in addition to
looking at shopping cart abandonment, we took a look at how product recommendations helped eCommerce stores across three key metrics.

Specifically, we wanted to know

  • Intent - Did recommendations effect the number of items customers placed in carts?
  • Conversion Rate - Did personalized product recommendations have an effect on purchase rate?
  • AOV - Did product recommendations have an effect on the total number of items purchased.

The Data: Where we got it and how we cleaned it

Our goal is to understand how product recommendations helped eCommerce stores.


We know that product recommendations work generally. As Wharton professor Kartik Hosanagar states, "We know these recommendations have a pretty significant impact on consumer choice. For example, at Amazon, they drive anywhere from a quarter to a third of the choices that consumers make."

The first step was gathering data. We aggregated session data from customers who use Barilliance's product recommendation engine.

Our goal is to understand how product recommendations helped eCommerce stores.

Product Recommendations Effect on Items in Cart

Our first question was whether seeing product recommendations effected the number of items customers placed in their cart.

Product recommendation effect on purchase items

Product recommendations improved the average number of items placed in the cart by an impressive 68.14%. Customers who were either not shown product recommendations or elected not to click product recommendations placed 2.21 items in their cart.

Conversely, those who engaged with product recommendations entered as many as 3.9 items.

As expected, the biggest improvement came from seeing 0 product recommendations to clicking 1.

Seeing a single product recommendation improved the average number of items added to the cart by 13.94%. Interestingly, clicking on a second product recommendation improved the number of items by a similar amount 13.11%, before the marginal improvement dropped off dramatically. Clicking on the third product recommendation still had a massive positive effect over simply clicking two, but at 7.29% increase is just more than half the improvement of clicking on a single recommendation had.

Product Recommendations Effect on Conversion Rate

A more important question is whether product recommendations had a direct effect on conversion rate.

For the purpose of this study, we define conversion rate as the percent of customers who completed their purchase. Did accurate, relevant product recommendations improve the chance that customers completed their order?

Product recommendation effect on conversion rates

The answer is a resounding yes.

Product recommendations increased conversion rates by as much as 320%. Customers who did not click on recommendations completed their purchase 4.95% of the time.

That number shot up by 74% if they clicked on a single recommendation, to 8.63%. Looking at the data, you see a clear improvement in conversion rate until the customer engages with 7 or more recommendations.

At that level, the effect on conversions plateau. Still, the cumulative improvement is impressive. Stores that are able to engage customers with multiple product recommendations close 3x as many carts as those that fail.

Product Recommendations Effect on Items Purchased

We see that product recommendations have a tremendous effect on both the items customers place in their carts and their chance of completing the order.

In other words, we know recommendations improve intent to purchase, and conversion rate. Our final question is whether product recommendations improve the average order volume.

To obtain this data, we filtered out all the sessions that did not purchase, and compared the final number of items in the cart by the number of recommendations clicked.

Product recommendations effect on items purchased

Given our previous results, we expected a dramatic improvement in the number of items purchased for customers who viewed multiple product recommendations.This was proven true.

Clicking a single product recommendation improved the average number of items purchased by 25%.

In aggregate, product recommendations improved the number of items purchased by as much as 113%, more than doubling the AOV of stores that did not show product recommendations!

Compared to items placed in cart and conversion rate, the effect on items purchased had significantly more variance.

One explanation is that customers still removed items from their cart before completing their purchase. This would shrink the total effect, increasing the expected variance we would see in the data.

Next Steps

Product recommendations work.

They increase the number of items customers place in their cart before purchase by 68.14%, they increase the percentage of customers complete their purchase by 320%, and increase the average order volume by an 113%.

As the data shows, it is not enough to simply show product recommendations. The more customers engage with your offers, the more impact you will have. It is imperative that stores take time to set up effective rules for product recommendations.

If you want to see for yourself how Barilliance helps our customer's achieve these results,
click here.

The post Product Recommendation Effect on Black Friday Weekend appeared first on Barilliance.

Black Friday 2017 Cart Abandonment Stats

$
0
0

Black Friday, the single highest selling day in eCommerce, just passed. This year we looked at over 18 million sessions over Black Friday and Cyber Monday weekend from top performing eCommerce stores. 

​We looked at cart abandonment rates across both geography and device.

​For an in-depth study on how ​product recommendations effected conversion rates and AOV on Black Friday weekend, click here.

Key Takeaways from Black Friday Cart Abandonment Rates

  • 74.5% US Cart Abandonment - the highest cart abandonment rate by country was the United States. 74.5% of all carts were abandoned.   
  • 10.6% Improvement in AOV for Desktop - Desktop transactions had an average of 10.6% more items in their cart. 
  • 15.9% Increase in Cart Abandonment for mobile- Despite improvements in mobile experience, transactions on mobile continue to experience dramatically higher cart abandonment rates.
Black Friday cart abandonment statistics

Black Friday Cart Abandonment Stats Breakdown

Cart Abandonment by Territory

Global cart abandonment over Black Friday weekend came in at 72.5%.

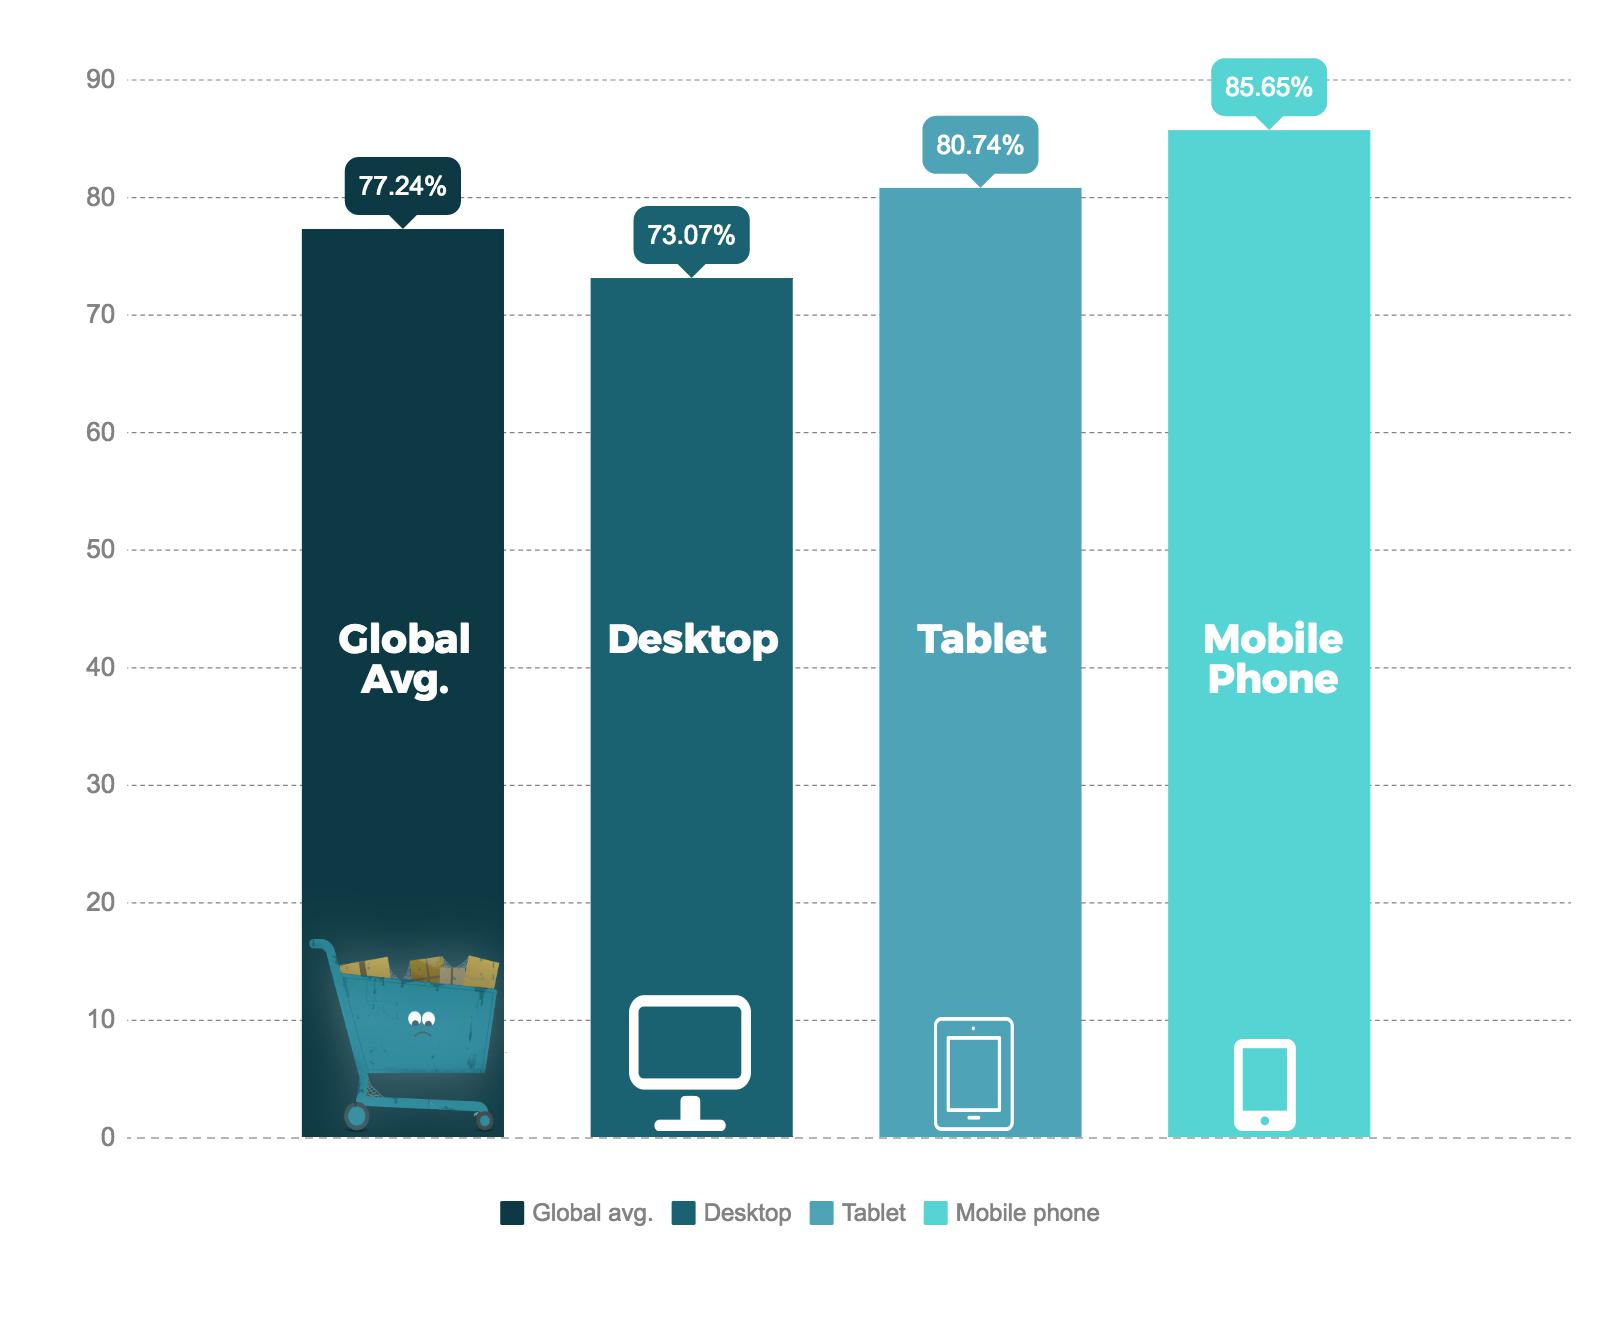
Interestingly, this is significantly lower than the global cart abandonment average last year. In 2016, the average cart abandonment was 77.24%, a full 5 percentage points higher.


The United States experienced the highest levels of cart abandonment at 74.5%.  Meanwhile, Spain had the lowest overall cart abandonment rate at 70.0%.

Here's a quick breakdown of the four countries with the largest presence in our dataset.

Territory

Conversion Rate

Cart Abandonment Rate

Global

2.7%

72.5%

United States

2.6%

74.5%

England

2.9%

70.7%

Australia

3.7%

70.6%

Spain

2.3%

70.0%

Cart Abandonment by Device

Across the board, mobile performed the worst of all devices. At the Global level, mobile 10.7% worse than desktop.

In the United States, this disparity increased to 12.9%. In the US, consumers completed 31.8% percent of their transactions on the computer, while only completing 18.9%

Next Steps + 2 Resources

Mobile offers the highest opportunity for most eCommerce stores. According to Smart Insights, 71% of all website traffic in the US came from mobile. 

Yet...

Mobile has both the highest cart abandonment rate and the lowest average order volume. 

Overcoming these challenges requires technology that is adaptive across platforms.


Finally, I want to leave you with two resources.

The first is our in-depth Shopping Cart Abandonment Guide. We cover everything from how to correctly measure cart abandonment to specific strategies and tactics you should employ to lower cart abandoment for your store. 

Second, is our own shopping cart abandonment product. To learn how Barilliance helps eCommerce retailers reduce cart abandonment, click here.

The post Black Friday 2017 Cart Abandonment Stats appeared first on Barilliance.

iOS Dominates Mobile Conversions and Other 2017 Stats

$
0
0

Mobile has taken control of traffic.

Around the world, mobile has surpassed desktop - and in 2018 shoppers will use their mobile devices more than ever. According to 
comScore, the average shopper in the US spends 71% of their digital time on mobile.

Mobile Traffic Per Country

Unfortunately, most studies lump all mobile users together.

Here's the thing...

Not all mobile users are created equal. As tracking tools and advertising platforms mature, we have an opportunity to do more than segment based on mobile or desktop.

We looked at mobile traffic in two major ways. First, has mobile continued it’s march toward traffic dominance in 2017? Second, can we maximize ROI through better mobile segmentation.

Key Takeaways

Mobile traffic continues to grow. Instead of simply focusing on “mobile” as a whole, eCommerce stores ought to look at ways to further segment these audiences.

The truth is…
iOS and Android shoppers act differently.

While the gap between the two is closing, iOS customers still go through on their purchases almost three times as often as their Android counterparts.

To maximize return on advertising spend, eCommerce marketers should create separate campaigns for Android and iOS shoppers. It is imperative that eCommerce stores test this segmentation for themselves, as each store is unique.

The Data: Where we got it and how we cleaned it

This study looked at over 1.4 billion sessions, from 2015 - 2017. To make the data as accurate as possible, we included the most recent companies in each year.

Unfortunately, this means that not all companies are the same from year to year.

Lastly, while some studies lump tablet and phone usage into a single "mobile" metric -  we do not. We separate tablets out into its own distinct category where we include the data. For most analysis, we took out tablet sessions to highlight the differences between mobile and desktop.

Why you need to improve mobile campaigns in 2018

​Mobile Continues to Conquer Traffic

The shift to mobile is an unrelenting march. We charted the three major device types (phones, tablets, and computers) from 2015- 2017.

In January 2015, mobile accounted for 19.47% of total traffic. That month, desktop traffic was 346.97% the size of mobile - accounting for 67.57% of customer’s shopping sessions.

That quickly began to change.

In 2015, mobile traffic grew 48.83% while computer traffic dipped 12%.

At the beginning of 2017, customer’s shopped on phones 38.76% of the time. Four months later, sessions on phones eclipsed computers for the first time. 


Today, phones account for 50.48% of all eCommerce traffic. Meanwhile, computers’ share has plummeted from a commanding 67.57% to 41.47% - a 63% drop in three years.

Mobile Conversion Rates Increased by 123% Since 2015

As mobile traffic has grown, more brands have put in efforts to increase conversions from mobile traffic.

The increase has been substantial. The earliest data from our study shows that mobile traffic was only converting at .5%. Since, conversion rates have almost tripled! 

​But mobile still converts substantially lower than desktop

Unfortunately, despite the improvements eCommerce stores are still struggling to convert mobile shoppers at the same rate as desktop ones.

At the start of 2015, a shopper using a computer was 366% more likely to buy during their session than a shopper on a mobile device. However, as more and more brands began focusing on mobile interactions, conversion rates on mobile devices sky-rocketed.

From 2015-2017, mobile eCommerce conversion rates increased 123%.

Despite brands’ progress on mobile, shoppers still convert at a significantly lower rate. Computer shoppers are still almost twice as likely to complete their purchase on a desktop session.​​​​

Key Takeaways

​As the mobile tidal wave continues it is more important than ever to focus on mobile interactions. Instead of leveling off, shoppers are relying ​more than ever on mobile devices. 


We expect this trend to continue through 2018.

Maximizing ROI from Mobile Campaigns

There are abundant resources on how to create and improve mobile campaigns.

Unfortunately, most of these articles treat mobile as a single homogenous group. However, today’s tracking and ad platforms can further segment mobile traffic in two significant ways.

First, we can segment mobile by the operating system the device is using (iOS vs Android).
Second, we can segment mobile by the actual device being used (iPhone X, Note 8, Pixel 2, etc.)

This study will focus on the first approach - segmenting mobile traffic by operating system. We look forward to continuing this study using the second approach for further refinement. 

​Which Platform has a higher average conversion rate?

Shoppers on iOS convert at incredibly higher rates than Android customers. While conversion rates increase steadily for both groups, iOS outperforms Android at every period.

However, Android is closing the gap.

At the start of 2016, iOS outperformed Android by 213%. One year later, that lead has shrunk to 160%. By the start of 2018, Android will perform it’s best relative to iOS.

Apple shoppers will still convert (on average) 149% more, but the trend is going towards parity.

Which Platform Sells More Items/Cart

Interestingly, while iOS converts a much higher percentage of sessions into purchases, the average number of items per purchase is much closer. Our data shows that Android purchases actually outperformed iOS purchases until the second half of 2017 where Android numbers plummeted.


This is in contrast to a few other studies.

For example, study from MOZ shows that Apple users spend almost 3x as much per transaction. 

Although shoppers may buy similar amounts, the conversion rate differences still point to platform segmentation as a massive opportunity. 

Next Steps

As you prepare your mobile strategy for this year, recognize that customer eCommerce behavior continues to move toward mobile.

Mobile should be an integral part in your personalization strategy.

Current best practices include:

  • Relevant First Offers - All pages, but especially the home page, should be tailored to fit customer's known category, brand, or product affinities. 
  • Specific Recommendations- Last month we looked at how successfully implemented product recommendations almost double sales and quadruple conversion rates. 
  • Cross Platform - Shoppers should be able to pickup their session between computers and mobile seamlessly.

This, of course, is just an introduction to obtaining success on mobile. To learn how Barilliance helps eCommerce brands succeed in this changing environment, request a demo here.

The post iOS Dominates Mobile Conversions and Other 2017 Stats appeared first on Barilliance.

What is Retention Marketing

$
0
0

Improving your retention rate is a massive opportunity in your business. This article breaks down successful retention strategies by some of the most successful eCommerce stores.

 An often cited study by Bain & Company (in conjunction with Harvard Business School) has said that a 5% increase in retention can improve profitability by as much as 55%. 

​Implementing the lessons learned from these top retention marketing strategies will increase profitability in three major ways:

  • Increases LTV of customer - As you increase the frequency and amount that each customer spends with you, you are directly impacting the LTV and profitability of each customer.
  • Enables new sales channels - by increasing the LTV of your average customer, you can afford to spend more on customer acquisition. 
  • Increases AOV -This study by Adobe shows that repeat customers make up 40% of sales, while only representing 8% of customers. 

How to Develop a Retention Marketing Program

There are two questions you need to answer to successfully create and implement a retention marketing program.


1)  How many customers are leaving?
2)  Why are customers leaving


But before we dive into how the most successful eCommerce stores are utilizing retention strategies in 2018, I want to define what retention marketing is.

What is retention marketing?

Retention marketing is a strategy which focuses on your existing customer base. The goal is create repeat customers, and increase both their frequency of purchase and the average order volume per purchase.

The most popular metric to measure the success of a retention marketing campaign is retention rate.

How do you measure retention rate?

Retention rate measures what percentage of your customers are retained during a given period of time. It is the inverse of churn rate, which measures how many customers leave during a given timeframe.

If a customer continues doing business with you, they are retained. If they are no longer a customer, than are "churned".


The formula, according to Inc., is customer retention rate = ((CE-CN)/CS) * 100, where:

– CE= number of customers at end period

– CN= number of new customers during period

– CS= number of customers at start of period

Determining what a "good" retention rate depends on a number of factors -> your industry, product, switching costs, and business model. 

Retention Marketing Strategy #1: The RealReal & Advocacy

Retention Marketing Through Advocacy

What is Advocacy Based Retention?

Advocacy marketing focuses on getting current customers to talk about your product to their friends or network. It depends on capitalizing on positive experiences to not only gain customers, but increase retention.

​How The RealReal Increases Retention through Advocacy

The RealReal formalized their advocacy marketing with their “Refer a Friend” offer. The program encourages repeat purchases for customers who choose to refer in a number of ways.

1) Consistency Bias - By openly endorsing The Real Real, these customers are more likely to use the service again. This phenomenon is known as the Consistency Bias.

2) Monetary Incentive - Second, this program provides a direct monetary incentive to use the platform again in the form of Store Credit.

Retention Marketing Strategy #2: Instacart & Reactivation Campaigns

Retention Strategy through Reactivation Campaign

How Reactivation Campaigns Increase Retention

A reactivation campaign is a series of messeges delivered to past customers who are no longer engaging with your products or service.

At Barilliance, we focus on personalization above everything else.

Like all retention strategies, to be successful, a reactivation campaign must first identify a specific segment of customers that are about to leave or that have already left, and second, accurately determine why they are leaving and propose a value proposition to overcome this.

One simple example is to set up a rule that sends an email based on recency of visit.

In this example, the segment is “Customers who haven’t visited the site in x days.”. The copy and series of messages should be directly tied to ​why your customer stopped ordering from you.

Return Path conducted a great study on best practices for reactivation campaigns. Some findings include:

  • Specific Dollar Incentives - Specific dollar incentives in the subject line are almost 2x successful as % off discounts (despite most emails using % incentives)
  • Recency Matters - Reactivation campaigns are more effective the sooner they are launched. Emails sent to “long inactive” customers had a meager 1.8% read rate compared to 12% average.

​Instacart's Reactivation Campaign Example

Instacart provides a great example of how to conduct a reactivation campaign.

The First Email

Their first email in the campaign urges the customer to download the app and gives a nice little bonus of free delivery. They also use urgency by putting a clear expiration date on their offer.

Retention Marketing Reactivation Campaign Example first email

The Second Email

When a customer doesn’t bite, Instacart is quick to send follow-up emails. Each day an email is sent. The additional emails do a great job reinforcing the scarcity and developing the value proposition of why they should buy again.

In this example, they identify three ways Instacart benefits you in addition to the free shipping bribe.

Retention Marketing Reactivation Campaign Example 2nd  email

The Sixth Email

At this point, most eCommerce reactivation campaigns are run through. However, Instacart shows how you don’t need to take no as a finality.

First, they empathize with their customer. The copy removes guilt from the transaction. It makes it ok that their first offer wasn’t taken, and gives permission to take advantage of the offer after the expiration date.

Retention Marketing Reactivation Campaign Example 6 email

The Ninth Email

As customers continue to decline, Instacart begins builds more reasons for their customers to re-engage.

At the 9th email they introduce a monetary incentive to entice customers to come back. Notice that they use an exact $ amount, per the best practice.

Retention Strategy through Reactivation Campaign

Retention Marketing Strategy #3: Holla & Daily Deals

Retention Strategy #3 Daily Deals

The Two Types of Deals For Retention

There are two main types of deals eCommerce stores use to drive repeat purchases.

Discounts - Offer products at a reduced price.
Exclusivity - Offer products not normally carried to a particular group.

​How Hollar uses Daily Deals to Drive Repeat Purchases

Hollar is a fast growing online dollar store and do an excellent job leveraging daily deals to drive repeat purchases.

A few tactics that Hollar uses to make their deals more effective are:

  • Consistency - Hollar has committed to integrating deals as part of their retention strategy. It is a perfect fit for their value proposition of low priced, high quality products. Because they promote deals daily, their customer base expects it and looks for opportunities to take advantage.
  • Branding - Each daily deal is branded as a “Wow!” deal, adding to the expectancy of each deal.
  • Urgency - Again, we see urgency used. Hollar forces customers to act now if they want to take advantage of the deals. Each offer expires today. 

Retention Marketing Strategy #4: Thrive Market & Subscriptions

Using Clubs + Premium Memberships to Increase Retention

Premium memberships are not a new concept.

The most famous example is Amazon Prime. Amazon offers free 2 day shpping (in addition to unlimited streaming through Prime Video as well as the ability to “borrow” books on the Kindle platform) in exchange for a yearly membership fee.

Some estimates say that the average
Prime member spends 2x as much as non-prime members.

​How Thrive Market Uses Memberships To Drive Retention

Thrive’s whole business model revolves around it’s premium membership.

Like Costco, customers sign up for one yearly membership. This membership the primary revenue driver for Thrive, as they sell their products for near cost to their customers.

Thrive Market does an excellent job reducing friction through the signup process. First, they allow you to see exactly how much money you would save by becoming a member. Then, they give you a month free.

This membership design encourages retention in two significant ways. First, because customers pay upfront, customers want to shop more at Thrive to maximize their benefits. Second, Thrive Market’s business model allows them to monetize their customer base in a different way, giving them a competitive price advantage over other online grocers.

Putting it all together

Because retention is the most effective way to increase profits, all of these eCommerce brands incorporate multiple strategies.

Here's how Hollar & TheRealReal integrate multiple retention marketing strategies.

The RealReal adds Exclusive Offers (Retention Strategy #3) + Premium Memberships (Retention Strategy #4)

We already saw how The RealReal utilizes customer advocacy to boost retention.

They also take advantage of exclusive offers. 

Like Holar TheRealReal uses deals to encourage customers to return. However, instead of providing a straight discount on their products, they focus on providing additional value through credit. 

This makes the retention strategy even more successful. The customer only gets the $100 bonus on their next visit. 


The RealReal Premium Membership (Retention Strategy #4)

Additionally, TheRealReal leverages memberships to increase the benefits of becoming a loyal customer. 

However TheRealReal's membership model differs from Thrive's in a number of ways. 

First, it is primarily centered on getting "first look" access to new, one of a kind products. Next, it offers multiple tiers to its membership program. 

Key Takeaways

Don't constrain yourself with a single retention strategy. Each strategy can be modified to fit your specific positioning. 


For example, if your brand is positioned as the premium option (like TheRealReal) in the space, focus on creating value through exclusive events, products, and customer service/experiences. 

Next Steps

The first step is to commit to retention. This means tracking your retention rate, selecting a core customer segment to target, and creating retention marketing strategies to improve.

To learn how Barilliance helps eCommerce brands identify priority customer segments and create targets reactivation campaigns, read about our retention marketing product or request a demo here.

The post What is Retention Marketing appeared first on Barilliance.

RFM Analysis

$
0
0

RFM Analysis will empower personalized marketing, increase engagement, and ultimately improve sales.

Today, we are breaking down what RFM analysis is, share step by step instructions on how to conduct your own analysis, and share example case studies and next steps to maximize your ROI.

What is RFM Analysis???

RFM analysis is a customer segmentation technique. RFM itself stands for Recency, Frequency, and Monetary Value.

The central idea is to segment customers based on when their last purchase was, how often they’ve purchased in the past, and how much they’ve spent overall. All three of these measures have proven to be effective predictors of a customer's willingness to engage in marketing messages and offers.

While RFM analysis was born in direct-mail, it is a powerful tool for eCommerce stores to use today.

Benefits of RFM Analysis

Conducting an RFM analysis on your customer base and sending personalized campaigns to high value targets has massive benefits for your eCommerce store.

  • Personalize, targeted offers
  • (Much) higher response and conversion rates
  • Improve​​​​ unit economics
  • Increase revenue and profits

Great...How do I do it?

Segmenting your customers with an RFM analysis is easier than it looks.

We are going to break each step down, complete with screenshots & best practices. Keep in mind that your eCommerce brand is unique.

This isn't going to be the best way for your particular business, but it will be a great template for you to iterate on.

Let's begin.

Step 1: Set yourself up right

Before you can begin, you need to define the one KPI that matters most to your business for each segmentation: recency, frequency, and monetization.

To do this, you will have to connect your purchase history to each customer, and select a timeframe that you want to work with.

For our example, we are going to use the following KPI's and timeframe.


Recency: Date of Last of Purchase
Frequency: Total Number of Orders
Monetization: Average Order Value
Timeframe: 2 years 


As you will see, RFM analysis is a straight forward process. The goal is to systematically score each customer according to recency, frequency, and monetization. We do that by first rank ordering all customers across our chosen metric, and then scoring them based on how well they perform relative to the other customers in your database.

Step 2: Increase Response with Recency

There are a number of KPI's you can use for Recency.

  • Date of last purchase
  • Date of last engagement (such as site visit, conversation with team, click through, etc.)
  • Date of last activity (such as in-app usage, login, comment, etc.)

For this walk through, we are going to use days from last purchase as the primary metric. 

You should intuitively know which metric makes the most sense for your business. Chances are if you are a traditional eCommerce store, date of last purchase will be the metric of choice also.

Step 2.a : Import your data

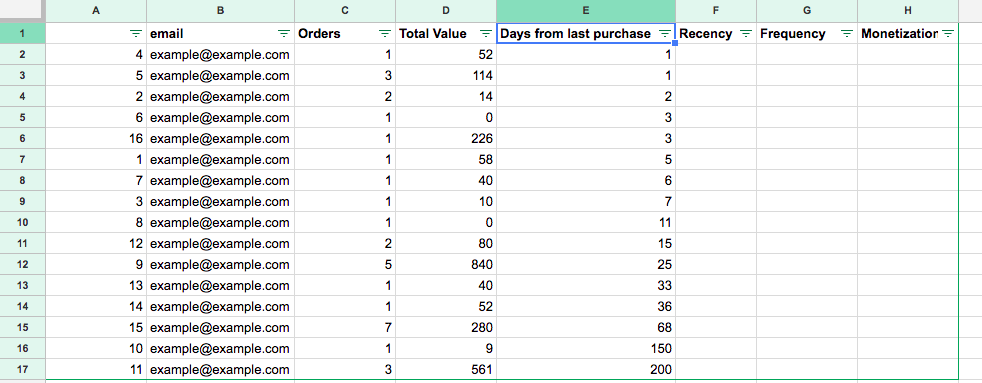
First, we want to download your client information with your specified KPI's. Here, we simply downloaded this information directly from Barilliance, and uploaded it into a Google Sheet.

RFM analysis data import

Next, we want to clean up the sheet a bit. 

I delete some unwanted columns I forgot to close out: Sessions, Last Seen, First Seen, First Ordered, and AOV.

Next, you are going to add three columns for your RFM scores. Title them across the top "Recency", "Frequency", and "Monetization". 

Finally, I apply a filter on the data to make it very easy to sort across. If you don't know how to apply a filter the process is easy. Select all of your data including your headings (you can do this quickly by holding down shift+command+arrows). 

Once all of your data is selected, click data->filter. 

After you are done, your sheet should look something like this. 

RFM analysis with data filter

Step 2.b : Sort your customers according to Recency KPI

Navigate over to your Recency KPI, and sort the list in the appropriate order. In our case, we go to "Days from last purchase" and sort in descending.

RFM Analysis sorted by Recency KPI

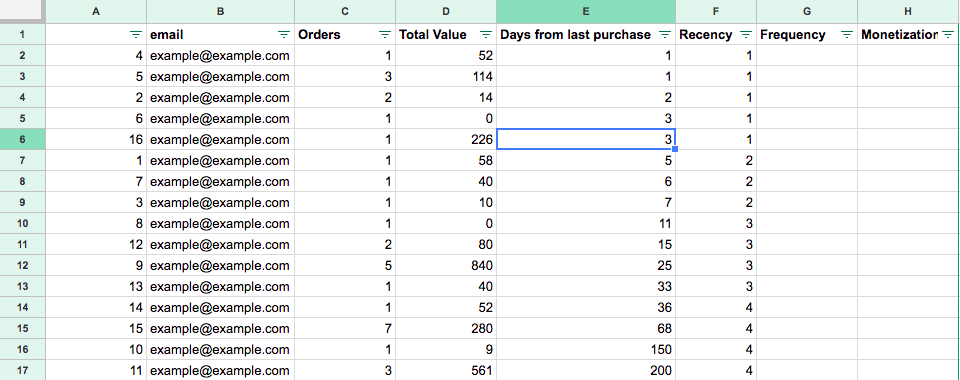
Step 2.c : Score each customer according to position

Finally, score each customer according to their position. 

While there a few methodologies for doing this, I've found the easiest and most helpful to be with quartiles. 

Take your total number of customers divided by four. Next, give each quartile a score reflective of the position. 

First Quartile: 1

Second Quartile: 2

Third Quartile: 3

Fourth Quartile: 4

Don't worry too much about getting everything "perfect".  For example, here we have two customers who have both ordered in the last three days. I simply assigned them both a recency score of 1, even though that puts 5 customers with a score of 1 and three with the score of 2. 

At this point, your sheet should look similar to the one below.

RFM Analysis with Recency Scores

Step 3: Increase Conversions with Frequency

The process is very similar for both Frequency and Monetization. 

While we are using the total number of orders over the past two years as our Frequency KPI, there are a number of competing metrics you can select. Some of them include:

  • Sessions/Visits - Especially useful for news or ad supported business models.
  • # of Click Throughs - If you are in pre-launch.
  • # of Conversions- Any other conversions that are important to your business.

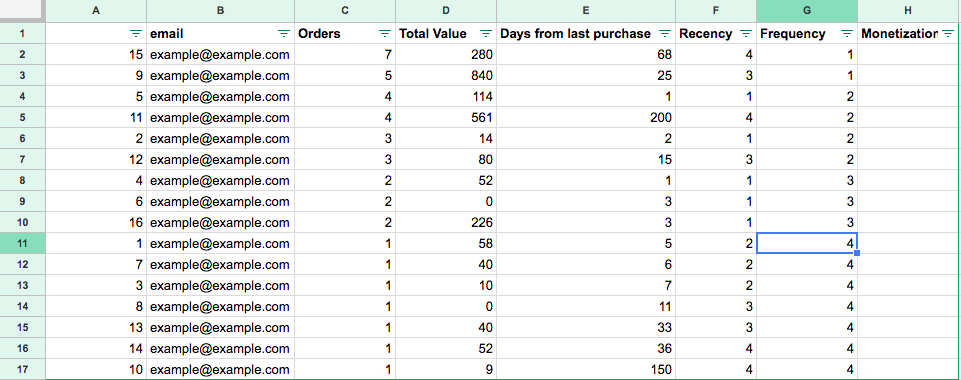
As mentioned before, we are going to be using # of orders as our Frequency KPI. Repeat steps 2.b and 2.c, expect use your Frequency KPI as your guiding metric. After scoring, your sheet should look similar to the one below.

Step 3: Increase AOV with Monetization

Finally, you are ready to knock out the Monetization scores. 

Monetization KPI's include

  • Total Revenue - This is the KPI that we are going to use
  • AOV - Helpful to identify those who purchase high tier items.
  • Engagement Metrics- Useful for two sided business models that don't directly sell products.

As before, repeat steps 2.b and 2.c, expect use your Monetization KPI as your guiding metric. After scoring, your sheet should look similar to the one below.

RFM Segments That Make Sales

Awesome! 

At this point you have the analysis done. Next comes the fun part - actually using these newfound insights to identify profitable segments. 

There are many ways marketers have used this segmentation to help guide their marketing. Here are a few ideas to cherry pick from.

Core - Your Best Customers

RFM Code: 111

Who They Are: Highly engaged customers who have bought the most recent, the most often, and generated the most revenue.

Marketing Strategies: Focus on loyalty programs and new product introductions. These customers have proven to have a higher willingness to pay, so don't use discount pricing to generate incremental sales. Instead, focus on value added offers through product recommendations based on previous purchases.

Loyal - Your Most Loyal Customers

RFM Code: X1X

Who They Are: Customers who buy the most often from your store.

Marketing Strategies: Loyalty programs are effective for these repeat visitors. Advocacy programs and reviews are also common X1X strategies. Lastly, consider rewarding these customers with Free Shipping or other like benefits.

Whales - Your ​Highest Paying Customers

RFM Code: XX1

Who They Are: Customers who have generated the most revenue for your store.

Marketing Strategies: These customers have demonstrated a high willingness to pay. Consider premium offers, subscription tiers, luxury products, or value add cross/up-sells. Don't waste margin on discounts. 

Promising - Faithful customers

RFM Code: X13, X14

Who They Are: Customers who return often, but do not spend a lot.

Marketing Strategies: You've already succeeded in creating loyalty. Focus on increasing monetization through product recommendations based on past purchases and incentives tied to spending thresholds (pegged to your store AOV). 

Rookies - Your Newest Customers

RFM Code: 14X

Who They Are: First time buyers on your site.

Marketing Strategies: Most customers never graduate to loyal. Having clear strategies in place for first time buyers such as triggered welcome emails will pay dividends.

Slipping - ​Once Loyal, Now Gone

RFM Code: 44X

Who They Are: Great past customers who haven't bought in awhile.

Marketing Strategies: Customers leave for a variety of reasons. Depending on your situation price deals, new product launches, or other retention strategies.

Key Takeaway

Segmenting empowers personalized, high performing campaigns and preserves profit margin. RFM Analysis provides a rubric to score each customer, and identify high ROI segments. 


Next Steps

Take action.

RFM is an established, clear way to get more out of your client list. 

But...

If you want to take RFM to the next level you need to consider Barilliance's Retention. It improves traditional RFM analysis in two fundamental ways.

First, it connects your online and offline purchases, web behavior, and demographic data in one place - allowing you to make more accurate segmentations. 

Second, it lets you automate campaigns to defined segments. It connects to Web Personalization and individual email product recommendations to customize each interaction not at the segment level, but at the individual level.

Request a demo for Retention here

The post RFM Analysis appeared first on Barilliance.


Abandoned Email Templates: Definitive Guide (Updated 2018)

$
0
0

This is the ultimate guide to abandoned cart emails. 

It is NOT just a collection of tips.

Instead, you will see successful strategies employed by the most successful eCommerce stores of 2018.

Here's the thing.

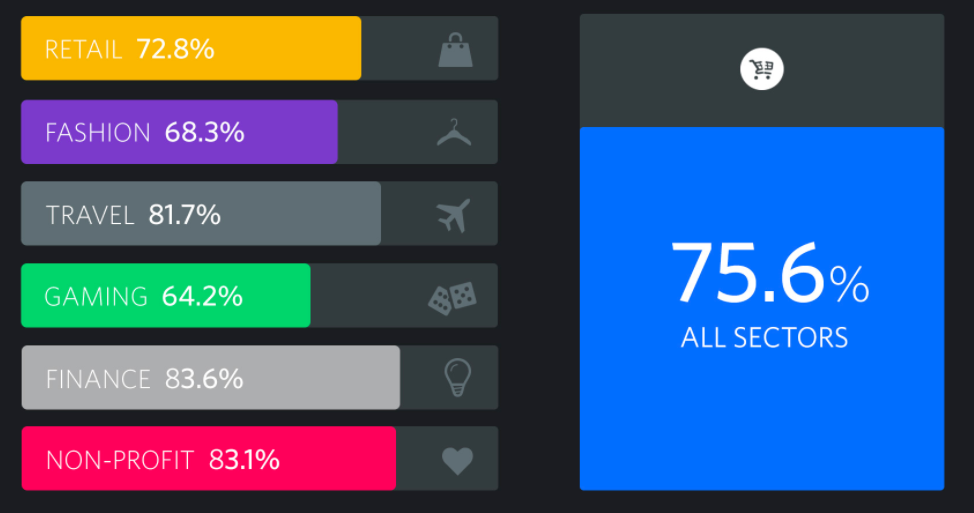
You need abandoned cart emails. Cart abandonment stats are not good, with some industries losing 83%+ of each sale when asked to put in their payment information. 

But not all emails are the same. Which is why we've collected the tactics and strategies of the most successful retailers, and distilled from them actionable cart abandonment email templates you can use for your own site.

Let's dive in.

Note: This page was originally published in 2016 and updated to reflect the current successful cart abandonment templates of 2018.  

Anatomy of a Cart Abandonment Email

Throughout this article, we are going to be creating powerful cart abandonment email templates.

To do this, we are going to break down a number of successful campaigns up into specific parts. 

Subject Lines That Get Opened

Joseph Sugarman, a legendary copywriter who has sold millions of units through direct copy, has a clear lesson on subject lines.

“The sole purpose of the first sentence in an advertisement is to get you to read the second sentence.”

With cart recovery emails, the first sentence is the
subject line. It is the single most important part of a recovery email because it is what compels prospects to open and see the rest of your email.

Pouring over abandonment emails, we found four types of subject lines.

Accept My Bribe Subject Lines

These subject lines leveraged some type of incentive to get you to open the email. 

Some were straight to the point.

Bonobos wastes no space (or time) and comes out swinging with an aggressive 20% off incentive. 

Other stores are less direct. One common tactic we saw employed was exploiting curiosity gaps.

While direct incentives work because they express a specific benefit, indirect incentives work because they don't give away enough information.

Curiosity gaps are powerful mechanisms. CopyHacker showed how using curiosity can increase conversions by 927%, and here we see Everlane dangling a carrot without letting the recipient know exactly what the incentive is.

Product Shout Out Subject Lines

The next group of subject lines focused on consistency and recognition. 

By using personalization, these subject lines injected the actual products that prospects were looking at in their email, creating a relevant, highly specific lead-in.

Above, The RealReal opens with a simple question and follows with the exact item that was left in my cart.

Brand Personality Subject Lines

A few eCommerce brands eschewed offers all together. Instead, they opted for more humanity centered subject lines. 

These subject lines used humor and/or personality to emulate a real conversation instead of a more transactional experience. 

Simple Subject Lines

Lastly, a number of retailers used simple, basic subject lines. The beauty in these subject lines is no non-sense, simple call to actions. 

I particularly like how The Honest Company customized their preview text with [OPEN]. 

It's also good to note that Faction Ski's preview text includes a product shout out. 

Logo & Copy: The Perfect Left Right Combo

Almost every single cart recovery email we studied opened their email the same way.

  • Brand Logo - Typically aligned center and sized to cover between 1/4 - 1/3 of the screen
  • Benefit Heavy Copy- We saw a lot of variation, from straight forward discounts, to free shipping and expiring discount codes.

There are a lot of good reasons for this. First, it capitalizes on whatever goodwill the prospective customer has towards the brand.

Second, it provides a consistency in the customer's journey from the eCommerce site to the email. 

Lastly, the benefit oriented copy often makes various appeals to complete the purchase. 

Basic Logo & Copy Combo

Thrive Market Logo and Copy Abandoned Cart Email Example

Thrive Market provides a great example of the basic combo.  Like most of the other abandonment emails, the logo is centered and well sized to cover about 1/4 of a mobile screen. 

Thrive Market follows this up by iterating its core value proposition: great products for less. They add great personalization in the email by injecting the exact amount you would save if you complete your purchase.

Finally, they designed an branded CTA button.

Added Value Variation

Bespoke Logo and Copy combo for abandoned cart emails

The Added Value variation offers a secondary value proposition in addition to their core products. This could be in the form of shipping, exclusive offers, gifts, various discounting schemes, or any other additional value offer.


Bespoke Post is an example of an Added Value variation. Instead of focusing on their core value proposition, they give the prospective customer another reason to complete their purchase: free shipping.

Manufacture Urgency Like a Pro

Everlane Cart Recovery Email

Everlane is an excellent example of how to layer urgency onto the basic combo.

They accomplish this through an expiring coupon. The deadline gives a real, tangible reason to act now instead of putting off the purchase.

Entice with Cart Images

The next most common element in abandoned cart emails are cart images. 

While there were a few retailers who did not include product images of the cart, almost all did.

What is more interesting is the way they displayed the images.

Some retailers opted for simple representations of their product, while others chose to include much more information in their widget.

Simple Cart Images

Bespoke offers a great example of a simple, direct cart image. Product name, price, and quantity are all that is needed next to a classic product image.

Bespoke product recommendatins for cart abandonment emails

Detailed Cart Images

Detailed cart images include additional information about the product. 

Below, Bonobos shares more than just the name of the product. They include some flavor text, allowing the customer to envision how they will use the product. 

Bonobos Product Recommendations

Maximize AOV with Personalized Product Recommendations

Abandoned Cart Email Product Recommendations

The last major element in cart abandonment emails are product recommendations. 

Many retailers who utilized product recommendations personalized their offers to match what was originally placed into the cart. 

Most of the product recommendation widgets were similar: they had a product image coupled with a product name and CTA button.

Thrive Market Product Recommendations for Cart Recovery Emails

But, a few eCommerce stores had unique tactics.

One of my favorite examples is below.

Here, in addition to providing a number of similar products personalized for the shopping session, Bonobos included an enticing category offer of "Editor's Choice".

The RealReal Product Recommendations in Abandoned Cart Emails

Key Takeaways


Cart abandonment emails are made up of well defined parts. You can create powerful emails by combining multiple parts together. 


The most important elements in a cart abandonment email are an enticing subject line, value based copy, cart insertion, and product recommendations.

Putting It Together: Abandoned Cart Email Templates

We've gone over the main individual components of an abandoned cart email.

Now, we are going to explore the most common combinations to uncover the most popular, successful abandoned cart email templates.

Personal Offer Template

This is the most basic cart abandonment email template we found.

  • Logo & Copy - Typically, the logo is centered and the copy reiterates the value proposition of either the store or product.
  • Product Recommendation - Typically personalized to what was placed in the cart. 

The Personal Offer Template works because it strips the email down to the bare necessities: Your brand, reiterated value proposition, and additional cross and up-sale offers designed to get your customers back onsite.

Personal Offer Template Example

Faction Ski's offers the quintessential Personal Offer abandoned cart email template.

It's short, sweet, and effective.

Faction Ski's Abandoned Cart Recovery Email Template

Added Bribe Template

The Added Bribe Template was the most common cart abandonment email that we found. It works by tacking on an additional bonus offer in the email to get customers to complete their purchase.

  • Logo & Copy - Typically, the logo is centered and the copy reiterates the value proposition of either the store or product.
  • Product Recommendation - Typically personalized to what was placed in the cart. 
  • Added Bribe - Could be in the form of free shipping, discounts, free gifts, or any other incentive to act now.

Notice how each retailer draws attention to their added bribe through color, section breaks, and enlarged text.

Added Bribe Template Examples

Here we see Bespoke adding Free Shipping to the order with a simple callout. 

As with the next example, it also includes all the characteristics of the Personal Offer abandoned cart email template.

Abandoned Cart Email Template

In addition to their standard free shipping, Bonobos offers an additional 20% off to complete your first purchase.

Bonobos Abandoned Cart Email Template full example

Mouth is our last example of the Added Bribe abandoned cart email.

Kitchen Sink Template

There were some abandoned cart emails that incorporated many more elements.

Product recommendations.

Unique offers.

Cart Images.

App CTA's.

Site Navigation.

The idea is to offer a mix of immediate incentives and multiple calls to actions to get prospects to click through.

Below, we see an example from Thrive Market. 

Abandoned Cart Email Followups

The most successful abandoned cart email campaigns include more than one email.

Surprisingly, most retailers we studied did not employ this best practice.

As we shared in our larger  Shopping Cart Abandonment Guide, followup emails can achieve amazing CTRs when you optimize the sending time. 

  • 1st Email, Sub-Optimal Timing - 12.2% conversion rate.
  • 1st Email, Optimal Timing - 20.3% conversion rate.
  • Follow-up Email Sub-Optimal Timing - 7.7% conversion rate.
  • Follow-up Email Optimal Timing - 17.7% conversion rate.

​​Below, we are going to share how The Honest Company utilizes followup emails to maximize conversions from their abandoned cart campaigns.

Maximize Conversions with Followup Sequences

The Honest Company keeps the same format for all of their abandoned cart emails. 

The template is simple.

  • Logo & Copy - Here, they stress urgency above everything else by imposing a time limit on how long they will maintain your cart.
  • Benefit CTA - Next, they reiterate their core value proposition of "Trusted, Effective, Delightful Products".
  • Added Bonus - Finally, they close with an added bonus of free shipping on orders over $50.

Honest Company First Abandonment Email

Honest Company First Followup

The followup email is an exact replica of the first, simply changing the amount of time remaining for the abandoned cart to expire.

Honest Company Followup

Honest Company Third Followup

As with the last followup, the next follows the same format with updated text.

Honest Company Final Followup

Even after the prospect has decided not to buy, The Honest Company persists with an opportunity to redeem their cart.

Key Takeaways


By studying successful retailers cart abandonment campaigns, we can identify successful templates that compel customers to complete their order. 

Next Steps

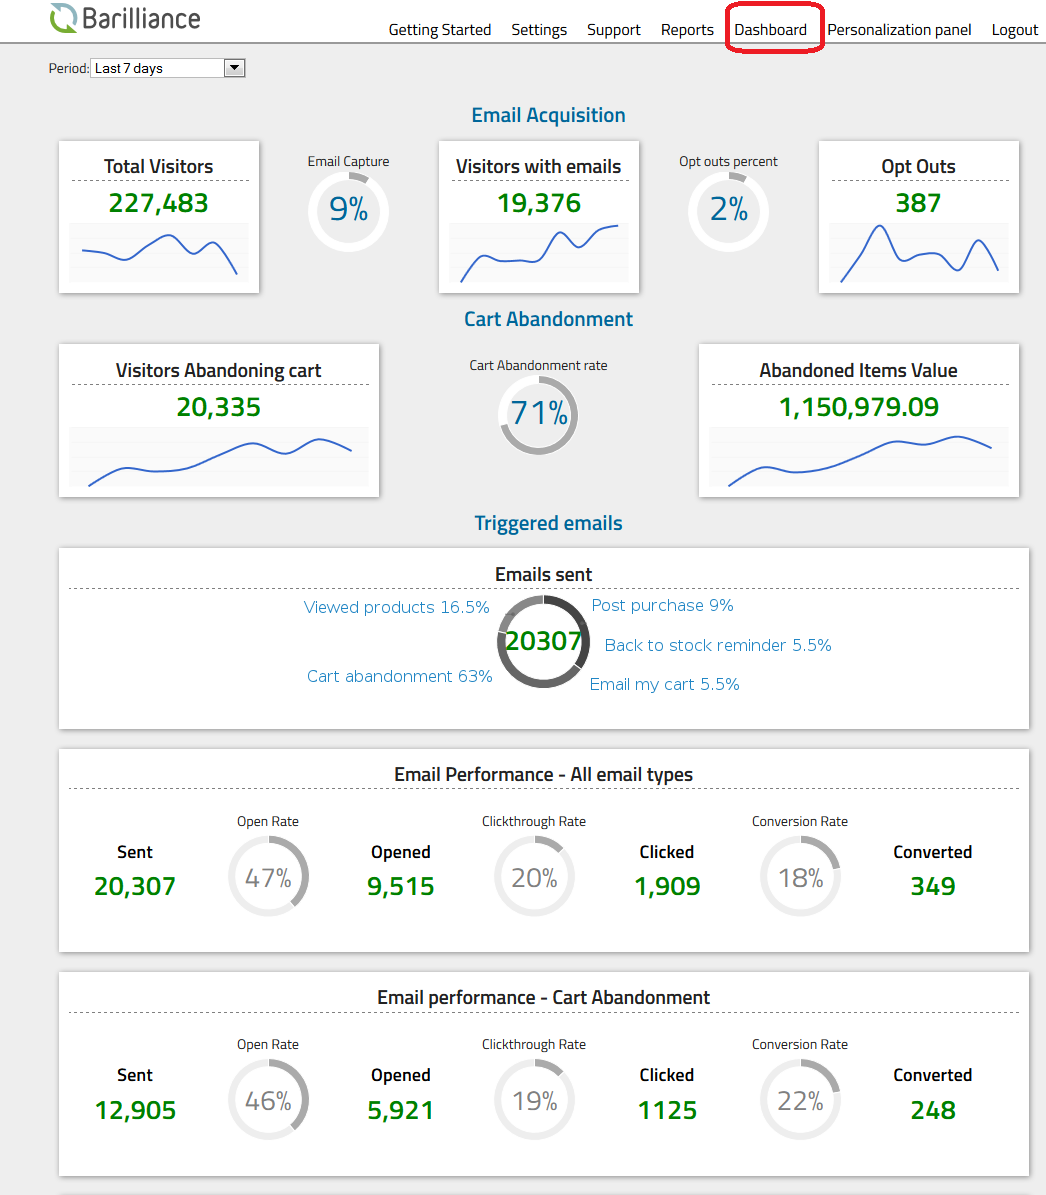
Barilliance Cart Abandonment Dashboard

Technology can make cart abandonment email templates extremely powerful through accurate personalization, and automating sequencing.

Barilliance is built for retailers who want to build cart abandonment campaigns. You can elect to have our machine learning system automatically personalize your emails, or you can set your own specific rules to match your merchandising strategy. 

In short, Barilliance empowers you to create

  • Multi-Step Campaigns - Design followup emails and automate when (and when not to) send abandonment cart emails.
  • 1:1 Personalization- Embed product recommendations and dynamic cart insertions, price drops, and customize email copy based on customer data.
  • A/B Testing & Reporting - Create and validate experiments with built in A/B testing and end to end funnel reporting.

And a multitude of other powerful features including cross-device continuity, coupon code support, rich segmentation, and email suppression logic. 

Request a demo here.

The post Abandoned Email Templates: Definitive Guide (Updated 2018) appeared first on Barilliance.

Abandoned Email Subject Lines: Definitive Guide (Updated 2018)

$
0
0

Cart abandonment emails work.

The problem is that
a ridiculous 269 billion emails are sent every single day.

This guide reveals how the best eCommerce stores are getting their abandoned cart emails opened. We reveal cart abandonment subject line  tactics and strategies, along,  with the exact copy, used by the most successful stores of 2018. 

Let's begin.

Note: This post has been updated to reflect the current cart abandonment strategies retailers are using in 2018.

The most common mistake in cart abandonment email campaigns.

According to our study covering 200 eCommerce stores worldwide, the highest performing cart abandonment campaigns recovered 40% of revenue! 

The key?

Sending more than one email.

Despite this, the vast majority of eCommerce stores only sent one or two abandonment emails. To maximize conversions,  you don't need to write a single cart abandonment email template. You need to write a minimum of three. 

And the single most important factor of each email is the subject line.

The Single Most Important Part of Your Email: Subject Line

According to Chadwick Martin Bailey, 64% of people open their emails based on the subject line. 

The challenge is, the best cart abandonment subject line is going to change depending on where in the funnel the email comes from.

The best cart abandonment subject lines result in incredible conversion rates.

  • Email 1 - Sent one hour after cart abandonment, 20.3% Conversion Rate
  • Email 2 - 24 hours after cart abandonment, 17.7% Conversion Rate
  • Email 3 - 72 hours after cart abandonment, 18.2% Conversion Rate

My favorite cart abandonment subject lines of 2018

I’m about to share with you my favorite cart abandonment subject line example.

The Honest Company focuses on natural health and food products, and is currently valued at $1.7 billion.

A huge factor in their amazing success is their ability to maximize revenue from each site visitor. Look at how well they construct their cart abandonment subject lines to compel the prospect to click through and complete their purchase.

Email #1

The honest company, first email subject line

I love this subject line for a number of reasons. 

First, it has great voice and tempo. It is short, direct, and upbeat. Second, The Honest Company makes the best use of customized email preview text I saw during the study. 

They employ brackets around an all cap sized [OPENED] to stand out and tease a "to see" with ellipsis for good measure.  

Email #2

The Honest Company 2nd Cart Abandonment Email Subject Line

The second email was sent exactly 24 hours after the first. 

It was congruent in tone and voice to the first email. Even though the words themselves were simple, they convey an upbeat, friendly tone. 

Again, The Honest Company makes excellent use of the preview text. 

Lastly, The Honest Company uses a new tactic in their second email - urgency. They accomplish this through an imposed scarcity  of an expiring cart, and the copy centers around the fact that their cart will be expiring soon.

Email #3

The Honest Company third abandoned cart email

Their third abandoned cart email follows the cadence of the second, triggered to send 48 hours from the first.

Here, the subject line puts even more focus on urgency and loses the friendly tone. Instead, it is more matter of fact, underlining the urgency of the subject line.

Lastly, the preview text is again used to great measure. In this case, The Honest Company hints at an added benefit of free shipping.

While I wish this line was more personalized based on the shopper's cart, it still accomplishes it's goal of imposing time pressure and adding incentive to act now.

Email #4

The final subject line in the sequence is a last chance email. 

What is most instructive is how persistent The Honest Company is once they have a lead with demonstrated purchase intent. 

Despite the customer not responding to previous emails, they don't give up. Instead, they keep their promise, expire their cart, and invite them to come back. 

The Honest Company used a variety of techniques to create a fantastic. abandoned cart campaign. ​​​​

As we went over company after company, we saw many recurring themes, tactics, and strategies used. We consolidated the most common subject line types below, and provide a few examples for your swipe file.

8 Types of Abandoned Cart Email Subject Lines

In total, we discovered 8 subject line archetypes that retailers used to maximize conversions. 

Accept My Bribe Subject Lines

Accept My Bribe Subject Line Example

Incentives work.

You want to be abundantly clear that your prospective customer is getting hooked up with an excellent deal if they complete the purchase. Words such as deal, promotion, % off are all powerful trigger words for price conscious shoppers.


Bonobos executes this subject line perfectly.

The bribe is upfront and clear. The call to action is direct, and uses an active verb. Empty your cart - save 20%.

Accept My Bribe Subject Line Template Examples

  • Empty your cart with XX% off.
  • Take XX% off your cart before it's gone.
  • {Company Name} XX% off on your entire order for 24 hours only

Curiosity Subject Lines

Curiosity Based Subject Line for cart abandonment

Curiosity based subject lines are the exact opposite of the Accept My Bribe types. Instead of being direct and upfront with your offer, these headings get prospects to click through because they pique interest.


Everlane lets their prospects know that they are about to receive something. They just won't reveal what that something is until they click through. 

Again, I encourage you to contrast this to the example above as they really are two sides of the same coin. They both focus on creating value, but pull the reader into opening the email in completely opposite ways.

Curiosity Subject Line Template Examples

  • A Gift For You
  • Hi {Customer Name}, continue shopping with a discount!

Product Shout-Out Subject Lines

Real Real Product Shout-Out Subject Line

Consistency and recognition are powerful motivators to complete purchase.

Product shout-out subject lines leverage this to it’s fullest. They are to the point, and resurface the want or need the customer originally had when they placed the product in their cart.

Here, The RealReal uses a simple, friendly tone. They then personalize the subject line with dynamic cart insertion to create a relevant message to their prospect.

Product Shout-Out Subject Line Template Examples

  • Still Deciding? Your {Product Name} Is Waiting!
  • {Product Name} might be the one - Shipping and returns are both free

Suggestive Subject Lines

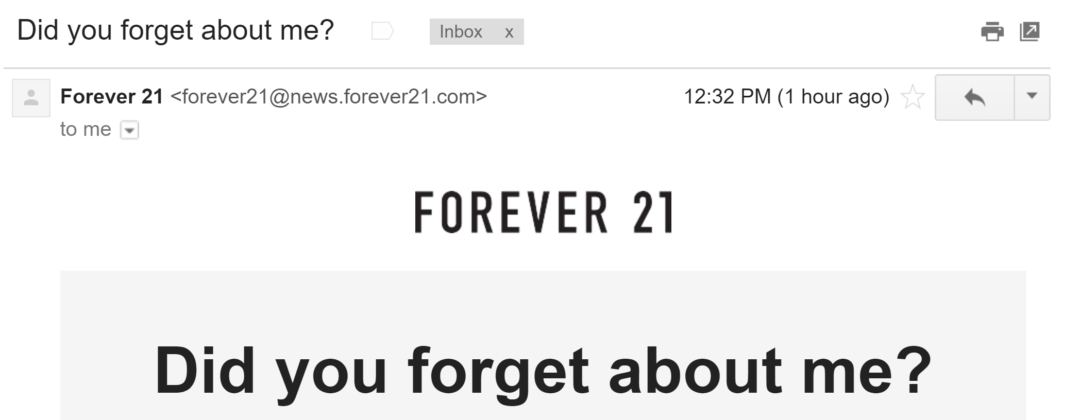
Forever 21 Cart Abandonment Email Subject Line

Suggesive subject lines often make use of the Assumption Principal, which underpins the famous “assumptive close”.

The
Assumption Principal functions by assuming the customer has already decided to make a purchase. In other words, it implies that the reason the customer abandoned their cart is because they forgot it rather than any other issue, such as costs, shipping, or finding a better alternatives.

Forever 21 gives a standard example. The subject line is simply "Did you forget about me?", and can easily fit for most brands.

Suggestive Subject Line Template Examples

  • Forgetting Something?
  • {Customer Name}, You Forgot Something!

Friendly Subject Lines

Chubbies Shorts Friendly Subject Line example

People don’t always appreciate the hard sell.

Simply being nice is a great way to engage prospects on a personal level. These subject lines establish a relationship that is not transactional based. Instead, they focus on being "friendly". 

Chubbies is a great example of this style. The subject line isn't trying to sell anyting.

Instead, it focuses on being human, greeting their prospect the way a friend would great someone they haven't seen in awhile. The body of the email carries the same voice. 

Friendly Subject Line Template Examples

  • Howdy Bud
  • Where'd You Go?!

Customer Service Subject Lines

Customer service subject lines actively try and solve customer's problems for not completing their purchase.


Oftentimes, these subject lines open a conversation with a simple question such as "Was there a problem with your order?" to learn what the issue was.  

Customer Service Subject Line Template Examples

  • Can We Help?

Brand Personality Subject Lines

Mouth Cart Abandonment Subject Line (Brand Personality Type Example)

You don’t need to make an offer in the heading to get your abandoned cart email opened.

Humanity centered subject lines work great.  Brand Personality lines do so with a focus on establishing the type of relationship you want with your customer. Oftentimes, these subject lines use humor to emulate a real conversation.


Here, Mouth plays on their name and stays light/playful throughout their copy calling their products "goodies" in the preview text.

If you go this route, make sure that your tone is consistant throughout all of your interactions with your customer.

Urgency Inducing Subject Lines

The Honest Company third abandoned cart email


Urgency and scarcity are often cited as the most powerful psychological ploys to get customers to act.

We see eCommerce brands create urgency in one of three ways.

The first is centered on the cart itself. Sometimes, they set the cart to expire, creating a sense that the customer needs to complete their purchase now. This is the tactic that The Honest Company used above.

Second, retailers create urgency around specific products within the cart. It may be a limited item, selling fast, or approaching out of stock.

Lastly, you can create urgency in your subject lines by pairing it with an incentive. Many retailers create discount codes that are only valid for a limited time to get customers to compete their purchase.

Customer Service Subject Line Template Examples

  • Hurry, the items in your cart are going fast!
  • Your cart is about to expire - still interested?

Key Takeaways

You can learn a lot from successful campaigns.


Ultimately though, you are in an unique market, at a unique moment in time, with unique customers. Take these subject line examples and tailor them to fit your company based on your own brand. 


Lastly, you can (and should) personalize your subject line as much as possible, whether through their shopping behavior, cart contents, or previously gathered information.

Subject Lines That Get Opened

Below are real examples of cart abandonment subject lines used by some of the most successful retailers in the world.

We've organized the subject lines by industry to make it easier to navigate and compare across industries. We'll be adding to this list over time as we gather more and more examples.

Note* When the email preview text was utilized to complement the subject line, we placed the preview text after a hyphen. 

Fashion Cart Abandonment Subject Lines

Company: The RealReal

Email #1: Still Deciding? Your Dolce & Gabbana Three-Button Wool Blazer Is Waiting!


Company: Warby Parker

Email #1: Downing might be the one - Shipping and returns are both free

Email #2: Downing felt the Connection


Company: Bespoke Post

Email #1: You've Left Something Behind

Email #2: Forgetting Something?


Company: Bonobos

Email #1: Empty your cart with 20% off.

Email #2: Take 20% off your cart before it’s gone.


Company: Modern Citizen

Email #1: A gentle reminder...


Company: Chubbies

Email #1: clocking in

Email #2: Howdy Bud


Company: Surfdome

Email #1: Thanks for visiting


Company: Forever 21

Email #1: Did you forget about me?


Company: Black Milk Clothing

Email #1: Where'd You Go?!


Company: SurfStitch

Email #1: Reminder: Get Your Items Before They Sell Out


Company: BooHoo

Email #1: Don't miss out! Your basket expires soon


Company: Everlane

Email #1: A Gift For You


Company: Under Armour

Email #1: Your Cart’s Loaded & Ready To Go - Free Shipping. No Minimum.

Email #2: UA Curry 4 Low Is Still in Your Cart

Health & Beauty Cart Abandonment Subject Lines

Company: The Honest Company

Email #1: Cart Reserved! [OPEN] to see…

Email #2: Don’t miss out! Your cart is expiring soon…

Email #3: Your cart is about to expire - You may qualify for free shipping >

Email #4: Cart Expired - [Items might still be available] - your cart expired!


Company: Urban Skin Rx

Email #1: Stephan, You Forgot Something!


Company: EyeBuyDirect

Email #1: EyeBuyDirect 15% off on your entire order

Email #2: EyeBuyDirect 15% off on your entire order for 24 hours only

Grocery Cart Abandonment Subject Lines

Company:  Thrive Market

Email #1: Oops, you forgot something

Email #2: Hurry, the items in your cart are going fast!

Email #3: Complete your purchase now - you made great choices. Check out now


Company: Mouth

Email #1: You left your Mouth open!

Other eCommerce Cart Abandonment Subject Lines

Company: Real Truck

Email #1: There’s something in your cart.


Company: Shower Pass

Email #1: We saved your cart for you

Email #2: Your cart is about to expire - Still interested?


Company: FloraQueen

Email #1: Hi Stephan, continue shopping with a discount!

Next Steps

The subject line is the first line of a cart abandonment email. You still have a long way to go. Below are some additional resources for you as you build out your own cart abandonment campaign.

  • Learn the best strategies with complete cart abandonment email templates here.​​
  • Learn how to put together an entire shopping cart abandonment campaign here.
  • Learn how Barilliance empowers hundreds of retailers to execute these strategies here.

The post Abandoned Email Subject Lines: Definitive Guide (Updated 2018) appeared first on Barilliance.

Personalization for eCommerce: Guide (Updated 2018)

$
0
0

This guide will break down exactly what eCommerce Personalization is, along with real examples and tactics being used by the most successful eCommerce stores.

Personalization is table-stakes in 2018.

Read on to discover how to use personalization to

  • Maximize Conversions with web personalization like Thrive Market
  • Increase AOV with personalized product recommendations like ThirdLove
  • Remove Fear with personalized social notifications like Fit Tribe


Let’s begin.

Note: This post has been updated to reflect the current eCommerce personalization strategies retailers are using in 2018.

Why You Need to Personalize Experiences

Web Personalization Location Based Example
Social Notifications Personalization
Inline Content Personalization example

Chances are your store now carries more SKUs than anytime before.

It makes sense.

There is more competition, endless shelf space, and an absolute need to match the perfect item to each individual customer.

The challenge?

There is real evidence that presenting prospects with too many options- from product launches, customizations, promotions, and combinations, are overwhelming customers and losing sales.

According to Accenture, nearly 40% of shoppers have left a store to buy from another site because they were overwhelmed with too many options.

Even if they don't leave, almost 75% of your potential customers will be frustrated with irrelevant content or products that are not specific to them.

Your customers expect relevant offers. Flooding them with a multitude of products does not work.


Further, a study by Evergage shows that 96% of digital marketeres agree that personalization advances customer relationships.

It is your responsibility to help site visitors find the right products. If you don’t, your customers will move onto the next store.

The solution is eCommerce Personalization.

Key Takeaways

Without personalization, you are losing 40% of your customers to other stores and wasting valuable opportunities to build deeper relationships with your customer.


What Real eCommerce Personalization Is:

Personalization is the real-time customization of a customer’s buying journey.

Unfortunately, many marketers execute the low hanging fruit 
and feel that they’re done.  In reality, most are just hitting the tip of the iceberg.

 There are unlimited ways you can personalize your store.

eCommerce Personalization beyond the basics

Types of eCommerce Personalization

I want to briefly touch on the major ways you can improve your customer's experience. 

By going over the major types of eCommerce personalization, you can begin understanding all the ways you can optimize your customer's journey - from when they first hit your site to after sales service. 

​How ​Personalization Software Works

Data is the lifeblood of personalization. 

Depending on your provider, personalization software will use a variety of data points to create the most accurate, highest converting experience for each individual visitor.

Barilliance uses the following types of data:

  • Demographic Data - Gender,  geo-location, age, and other demographic data remains a valuable segmentation tool. 
  • Customer Intent - We track a visitors site behavior and combine it with past session browsing history and actual purchases to understand what types of products and categories they are interested in.
  • Wisdom of the Crowd - For first time visitors, we default to aggregated data that makes correlations between previous customers and current site behavior.
  • Customized Variables - Lastly, Barilliance empowers eCommerce stores to manually set rules to guide personalization. This allows personalization to match your merchandising goals. For example, you can set preferred product categories. 

Website Personalization

1. What is Website Personalization

Website personalization tailors your actual site with dynamic content, messages, visuals, and offers for each individual shopper.

These eCommerce personalization tactics create much more relevant experiences across your entire site.


The three most popular KPI's for website personalization are:

  • Average Session Duration - Are your prospects spending more time on your site?
  • Increased Product Engagement - Are your prospects viewing more product pages and adding more products to their cart?
  • Increased Orders - Are you converting more prospects to real customers?

2. Types of Website Personalization

As personalization has exploded in popularity, so has the number of tactics that technology enables.

Today, you can personalize virtually any aspect of your website. However, these are the most essential pieces in terms of impact. 

Offers

Offers are the single most important aspect of your site to personalize.

You can customize the product itself, the price shown, impose time limits, or change the supporting copy and visuals supporting the offer.

Inline Content

After you've personalized your offer, you should focus on how you are educating and motivating your prospects while they are on the site. 

Personalize the content that is presented in front of your customers. You can change which featured products are shown, blog posts, downloadable assets, or hero images on any page.

Pop-Ups

Pop-Ups represent a "second net" or opportunity to progress your prospects when they are about to leave. 

If your site leverages pop-ups, you should optimize conversions by personalizing both the content and offer. All types of pop-ups can be personalized including browse abandonment, on-click, timed, on-scroll, and any other type.

Information Bars

Lastly, Information Bars and other call-out offers continue to be an effective way to maximize value of each site visitor. 

Personalizing information bars can be as simple as offering different shipping rates depending on location to offering higher priced items to returning visitors who are in the top 25% of your AOV in past orders.

3. Web Personalization Examples That Work

It's always best to learn from examples. 

Feel free to add these examples to your own swipe files as effective ways to personalize your eCommerce site and optimize your customer's experience.

Maximize Conversions Like Thrive Market

Inline Content Personalization example

Thrive Market is excellent at personalizing every aspect of the customer journey.

During on-boarding, I defined "Paleo" as one of my interests. When I return to the store's homepage, I see a series of offered content from their blog. 

Each post is tailored to my known interest of "Paleo". It is a perfect example of how to execute personalized in-line content.

Remove Friction Like Butterfly Twists

Web Personalization Location Based Example

Saving time and removing friction is one of the best uses of personalization. 

This is crucial when your store serves multiple locations. Here, Butterfly Twist pulls the IP address of my computer and personalizes the product page to default to American sizes.  

Personalized Product Recommendations

1. What are Personalized Product Recommendations

Today product recommendations are common.

However, some retailers are leveraging personalized product recommendations much more effectively than others.  

When used correctly, product recommendations increase the average number of items in the cart by 68.14% and increase conversion rates by an incredible 320%.

2. Types of Product Recommendations

Like web personalization, product recommendations have completely transformed over the past 10 years. 

In 2018, there are literally countless ways you can segment your product catalogue and pipe the perfect products into your recommendations.

That being said, some product recommendation templates have proven to be more effective than others. Some technology platforms, like Barilliance, allow you to place these recommendations anywhere on your site or within your email communication.

Best Sellers

One of the original product recommendation templates remains the most effective. People trust the crowd'e recommendation

Best Seller recommendations are great when you do not know a lot about your prospect. It gives you the best chance of suggesting something that fits their particular needs.

However, it is after you collect more information about your prospect that this type of suggestion becomes powerful.

Personalized "best seller" recommendation widgets perform twice as effective as those that are not personalized.

You Might Also Like

Items are based on currently viewed items. 

You should personalize the recommendations based on other website behavior or past purchases and determine if you should upsell by displaying higher-end alternatives or downsell and display lower priced products.

Cross Selling

This tactic shifts from suggesting similar products to complimentary ones.

By offering complementary products you can increase AOV by educating the customer on how to make their current selection better in some way.

THE REAL REAL Trigger Email Example

​What Customers Ultimately Buy After Viewing This Item

These recommendations help the customer navigate through your catalogue.

You should consider this type of personalization when you product list is large.

3. Examples of Product Recommendations

Increase AOV Like ​ThirdLove

Personalized Product Recommendations

This personalized product recommendation was on their product page.

ThirdLove customizes the products they offer based on the currently viewed product, matching the item with complementary products. 

The offer is especially effective because of how ThirdLove executes the entire widget.

  • Copy - "Complete your look" gives their prospects the idea to shop for a complete pair instead of a single item.
  • Matching Colors - The items they suggest are all in the same color as the currently viewed product. 
  • Offer - Lastly, they maximize the effectiveness by creating a discount when you purchase three items with their "3 for $27".

Personalize Best Sellers Like Thrive Market

Thrive Market eCommerce Personalization example product recommednations

As mentioned, best selling product recommendations are twice as effective when they are personalized to your prospect's known affinities. 

Thrive knows that I care about Paleo products. Because of this, they don't just show me the highest selling products of their entire site.

Instead, they restrict the offerings to products that match my affinity.

Personalized Similar Products Like TheRealReal

The Real Real Similar Products personalization example

eCommerce brands can (and should) personalize as many customer touch points as possible - including email.

The RealReal sends a personalized similar product widget along with their cart abandonment email. Notice that the offerings are based on what was originally in my cart. 

Personalized Social Proof Notifications

1. What are personalized social proof notifications?

Social proof notifications allow you to give real-time notifications and updates to your customers.

This is one of the newer ways to personalize your eCommerce site. Brands are leveraging this technology to provide relevant, contextual information about themselves, or the products they are viewing.

2. Types of personalized social notifications

Retailers have already pioneered a number of effective ways to use social notifications to increase sales.

  • Reviews & Testimonials - Present testimonials in a chat window about the the currently viewed product. 
  • Follow The Heard- Give customers confidence in your store by letting them know how many other are taking a similar action. One common example is how many other people are currently shopping.  
  • Urgency - Live notifications can be a powerful tool to combat cart abandonment. Let customers know which products are at risk of being sold out or how many customer's currently have the product in their cart. 

3. Examples of personalized social proof notifications

​Encourage Sales like Fit Tribe

Personalized Social Notifications

Fit Tribe does a great job of matching which live notifications they send to currently viewed products.

You can see how the live notification is sent, communicating how popular the product is and providing additional social proof with details like time purchased, and where in the world the customer came from.

Communicate Value like Kickers

Social Notifications Personalization

Here, Kickers underlines one of their key benefits: the durability of their shoes. 

What is interesting about this notification is how they customized the image to match the item in my cart. This tactic makes the message much more effective. As a prospect, I completely understand that this statement pertains to the items in my cart.

Personalized Triggered Emails

1. What are personalized triggered emails?

Lastly, eCommerce stores should extend their personalization efforts beyond their site. 

Email remains the most essential communication channel, and personalizing your correspondence will multiply your results.


A "triggered email" is sent based on some sort of user action. The most common type of triggered email is a cart recovery email, which is sent when a customer places an item in their cart but leaves without completing their purchase.

2. Types of personalizations for triggered emails

We've written extensively on triggered and cart abandonment emails before. 

However, it is worth noting some of the most common ways you can personalize triggered emails.

Demographic personalizations

The most common types of personalizations for triggered emails are demographic. 

Dynamically inserting a prospect's name in the subject line is a common tactic to call out attention in the sea of emails. 

Session personalizations

The next most common type of personalizations are session based. 

Common tactics include inserting products' names, images, and dates into the subject line or body of the email.  

These personalization tactics ensure that your email is relevant, following up on known wants of your prospect. 

Recommendation personalizations

The next most common type of personalizations are session based. 

Common tactics include inserting products' names, images, and dates into the subject line or body of the email.  

These personalization tactics ensure that your email is relevant, following up on known wants of your prospect. 

3. Examples of personalized triggered emails

We've already broken down triggered cart abandonment email examples in depth here

I encourage you to check out the post which goes over four of the most effective cart abandonment email templates used by hugely successful eCommerce brands in 2018.

Next Steps

This guide went over the four major ways you can personalize your customer's experience in an eCommerce environment.

Now is the time to begin scoping out your own personalization strategy.

  • Define Your Goal - What do you want to accomplish with personalization? How will you know you are successful?
  • Determine Capabilities - Your goal will determine which eCommerce personalization strategy you want to start with. 
  • Select a Personalization Partner - Finally, you need to select a technology partner that will empower you to accomplish your goals. 

We've put together a clear, step by step worksheet to help you select the best personalization vendor for your needs.

It covers the four biggest challenges in eCommerce personalization, and the most essential questions to ask potential partners to make sure they are capable of overcoming these challenges.

Read how to select your personalization vendor here.

The post Personalization for eCommerce: Guide (Updated 2018) appeared first on Barilliance.

Returning Customer Double Sales

$
0
0

How valuable is getting a customer back to your site?

In 2014, Harvard Business School published research showing that a 5% increase in retention results in increased profits of up to 95%!

We wanted to break down customer retention with the most recent data. Our question: how do returning visitors effect the most important KPI's in eCommerce across all industries?

Executive Summary: Return Visits Matters (a lot)

retention doubles sales

We found retained visitors:

  • Added items to carts 65.16% more than first time visitors
  • Converted 73.72% more than first time visitors
  • Spent 16.15% more per transaction

Customer acquisition is like planting seeds. It is a lot of effort and work and to prepare the land i.e. create the conditions to get a customer on site.


Retention takes that customer from seed to fruit bearing tree. All the profit happens in the retention stage where customers are much more likely to engage with your brand, add items to cart, convert more often, and spend more.


Taken together, retained visitors are worth over 2x as first time visitors.

The Data: Where we got it and how we cleaned it

To conduct this study, we sampled 1.3 billion sessions over the past two years. 

We wanted to see how retention effected the major eCommerce KPI's: add-to-cart rate, cart abandonment rate, overall conversion rate, and average order volume. 

This writeup focuses on how retention effects add-to-cart rate and conversion rate, while the next will focus on cart abandonment and average order volume.


Throughout this study, you will see that we segmented site traffic in two major ways.


First, we compared first time visitors to returning visitors, measuring the overall impact retention has on profits.

Second, we further segmented according to device type to see how retention’s value changes across devices.

Returning Visitors dramatically increase your add-to-cart rate.

The first step in getting a visitor to convert into a buyer is to engage them. 

Add-to-cart rate is a simple, effective measure that captures high level engagement with your site. 

In this one graphic we begin to see the value of retained customers. 

While new visitors added items to their carts on 4.84% of sessions, returning visitors added an item to their cart 8.26% of the time - a 70.6% increase on average.

2016

2017

All Sessions

6.09%

6.69%

New Sessions

4.60%

5.08%

Returning Sessions

8.12%

8.39%

% Change

+76.52%

+65.16%

Device Effect on Add-To-Cart Rate

Mobile continues to grow in importance across the board. Not only is mobile traffic growing as a percentage of overall traffic ( you can see our own study breaking down how to maximize mobile advertising spending here), but Google and other search engines continue to prioritize mobile in their rankings.


Because of mobile's continued importance, we wanted to see if retention's power was more or less important on smaller screens. 

The numbers are convincing.

Retention's effect on Add-to-Cart Rate

Desktop: + 58.18%

Mobile: +85.3% 


Returning visitors are even more valuable on mobile devices. 

This makes sense given the difficulties mobile presents: less real estate makes it more difficult to convey value and make offers that resonate. 

The truth is...

Creating relevant, remarkable first-time experiences can benefit your store more than customer acquisition efforts.

This is why you need to focus on retention. 

To discover how, check out our in-depth guide on the best retention strategies and tactics in 2018 all geared to increase your retention rate. 

Key Takeaways


Retention dramatically improves add-to-cart rates. On average, a returning visitor will engage with a product to the point of adding it to their cart 70.6% more often than a new visitor.


This effect is amplified on mobile, where that number rises to 85.3% more. As mobile traffic continues to grow as a percentage of overall traffic, retention will continue to grow in importance. 


If you want to increase your add-to-cart rate, focus on increasing your ability to get new visitors to return to your site. 


Returning Visitors dramatically increases your conversion rate.

While add-to-cart measures engagement and intent,  it's really only valuable in-so-far as it helps you understand your overall conversion rate. 

As a quick aside, for the purpose of our study we calculated conversion rate as the number of sessions that resulted in a completed purchase divided by the total number of sessions.

Therefore, adding the item to the cart DID NOT have to occur in the same session. We choose this methodology because it reflects real consumer behavior: customers shop, add to cart, abandon, come back, and may or may not complete purchase.

Retention's Effect on Conversion Rates

2016

2017

All Sessions

2.03%

2.12%

New Sessions

1.54%

1.56%

Returning Sessions

2.70%

2.71%

Returning Sessions

+75.32%

+73.71%

Retention has an even stronger effect on conversion rate. 

Returning visitors will complete a purchase about 75% more than a new visitor would. This effect has held relatively constant over the past two years.

Retailers must build loyalty and retention in their site to improve conversions. 

Obviously there are a number of ways that you can do that. However, one of the fundamental strategies you should employ is personalization.

A study by Accenture makes this clear.

  • 65% say they are more likely to shop at a retailer that knows their previous purchase history. 
  • 58% say they are more likely to buy if presented product recommendations based on past purchases. 

Accenture's findings are consistent with our own study on personalized product recommendations.

In that study, we found that creating personalized product recommendations had a massive effect on conversions.

  • 320% increase in conversions
  • 113% increase in average number of items in cart

Unlike the add-to-cart ratio, retention's effect on conversions did not increase on mobile.

That being said, returning customers were still clearly more valuable than new ones. 

Retention's effect on Conversion Rate

Computer: +98.54%

Mobile: +72.11%

Part of this can be attributed to the fact that personalization techniques are more easily implemented on larger screens.

On a computer, you are able to place more widgets and customizations. In contrast, many stores strip their mobile UX down to the essentials. 

This brings to light another important aspect in maximizing sales.

Many customers begin their purchase journey on mobile, and complete their purchase on a computer. To provide the best experience, you need to be able to track customer's across devices, identify them when they land on your page, and personalize your offers in real time.

Key Takeaways


Returning visitors buy (75%) more than new visitors. 
Personalization is a major reason why. 


When you are able to capture web behavior data and understand what types of products your prospect is interested in, you can personalize product recommendations and other offers to dramatically increase conversions.

Next Steps: How to Get Customers to Come Back

This study looked at how retention positively impacted two major eCommerce KPI's: add-to-cart rate and conversion rate. 

Next month, we will look at how retention effects both cart abandonment rate and AOV. 

However, from this study alone we can conclude three things. 


First, retention can be a driving factor for increasing add-to-cart rates.

Second, retention can increase sales, as returning visitors are 75% more likely to buy from you.

Third, personalization is a major key to maximizing the effect retention has on profits..

As mentioned, we've written a number of resources to help any eCommerce brand improve their efforts.

  • Learn How To Improve Retention - This guide breaks down what retention marketing is, and shares real life examples from some of the most successful eCommerce stores of 2018. Click here.
  • Learn How To Select a Personalization Vendor - To implement the personalization strategies you need to partner with a technology that is able to track customer data and empower you to make personal, relevant offers. This guide covers the biggest challenges in personalization, and will prevent you from making a poor choice.  Click here.

You can also see how Barilliance has helped hundreds of retailers combine and execute retention and personalization strategies to drive retention and increase profits by requesting a demo.

The post Returning Customer Double Sales appeared first on Barilliance.

Complete List of Cart Abandonment Statistics: 2006-2018

$
0
0

It's 2018 and cart abandonment continues to plague retailers. This post collects a number of cart abandonment statistics, both from our own database consisting of billions of sessions and third party studies.

The truth is…

You lose sales from cart abandonment.

The questions are
(a) Why customers leave your site without purchasing, and
(b) What you can do about it.

Free Resource: Our complete data-driven roadmap to reduce shopping cart abandonment. Click here to view. 

Note: This post has been updated to reflect the current cart abandonment statistics in 2018.

Average Cart Abandonment Rate

There have been hundreds of studies surrounding cart abandonment statistics.

Some studies place abandonment as high as 80%, while other studies place cart abandonment as low as 55%.

In our study, we found the average cart abandonment rate for 2016 was
77.24%. In other words, over 3/4 of shoppers choose to leave the site without completing a purchase.

However - as we show below - there is much more to the story of cart abandonment than the average. We segment these aggregate stat across three primary dimensions:

  • Over Time - How is cart abandonment changing over time?
  • Across Device - How does customer cart abandonment change between mobile and desktop?
  • Across Device - How does customer cart abandonment change between mobile and desktop?
  • Cart Recovery - How effective are current cart recovery campaigns

The good news is that you have a massive opportunity to dramatically increase revenue by transforming these abandoned carts into recovered ones.

Average Cart Abandonment

Cart Abandonment Trends: 2006- 2017

We compared abandonment rates between 2015 and 2016. Unfortunately, what we found was not encouraging.

In 2015, the global average abandonment rate was 71.39%. In one year, stores on average experienced an 8.4% increase in shoppers leaving without completing their purchase.

This trend held true across all devices.

Third party analysis from Statisa shows a similar trend. 

In 2006, 59.8% of shoppers abandoned their cart. By 2017 that number has risen to 69.23%, a 15.79% increase.

Cart Abandonment Statistics by Device

Today mobile traffic accounts for over half (50.48%) of all traffic in eCommerce. 

Unfortunately, according to our own research, there is a clear correlation between small screens and increased cart abandonment.

  • Desktop - 73.07% average shopping cart abandonment rate.
  • Tablet - 80.74% average shopping cart abandonment rate.
  • Mobile - 85.65% average shopping cart abandonment rate.

Mobile has the highest cart abandonment rates, with 85.65% of all transactions ending without a sale. Meanwhile, tablets converted sales 80.74% of the time, a 5.7% improvement in revenue.

Desktops performed the best in terms of cart abandonment, with 73.07% of transactions failed.

The trend is obvious. The smaller the size of the screen, the more likely a customer is to not purchase. This is problematic considering that for the first time ever, more digital buyers will use smartphones than desktops to shop.

Why is this?

According to
RetailDive, eCommerce shops are still not optimized for mobile. Slow load times abound. Many stores remain unresponsive, forcing customers to zoom in and out to navigate a page.

Worse, pop-ups that are fine on desktop take up are often not fine on mobile.

Further, every inconvenience driving cart abandonment on desktop - such as mandatory registrations and long checkout processes, are intensified on smartphones.

Cart Abandonment Statistics by Industry

Industry Cart Abandonment  Statistics

Data in aggregate can be misleading. The truth is, abandonment rates vary drastically from industry to industry.

In order to understand how your store is performing, you should compare your current checkout rates to other stores within your industry.

A study conducted by
Statista shows that the abandonment rate went up by over 24% from the Gaming Industry to the Finance Industry.

This graphic from 
SalesCycle illustrates the point nicely.

Cart abandonment statistics

As you can see, a "good" cart abandonment rate changes dramatically depending on what industry your store is in.

Finance and Non-Profits experience some of the highest cart abandonment rates, averaging over 10% more than the global average shopping cart abandonment rate. 

Meanwhile, Gaming and Fashion industries experience some of the lowest rates. 

Key Takeaways

Shopping cart abandonment is a major problem across all devices and industries.


However, the biggest challenges come on smaller screens (smartphones/tablets) and industries that require a lot of steps to complete such as finance.


Cart Abandonment Email Statistics

There are a number of important stats to keep track of an optimize in a full fledge cart abandonment campaign.

Below is a quick definition of the most important cart abandonment statistics. I've also included some global stats from the folks at MooSend.

  • Email Capture Rate - What percent of visitors are you able to capture a good email address?
  • Cart Abandonment Rate- What percent of your visitors abandon their shopping carts?
  • Abandoned Items Value- What is the monetary amount that you are losing to cart abandonment?
  • Cart Abandonment Email Open Rate- What percent of your cart recovery campaign emails are opened? According to MooSend, 45% of cart abandonment emails are opened on average.
  • Cart Abandonment Email Click Through Rate What percent of your cart recovery campaign emails that are opened are acted upon by clicking through to your site? According to MooSend, 21% of the emails are clicked on.
  • Cart Abandonment Email Conversion Rate- What percent of your cart recovery campaign emails result in a recovered cart? According to MooSend, 50% completed their purchased!

If you are a Barilliance customer, all of these statistics will be tracked automatically in your dashboard.

Cart abandonment analytics

Shopping Cart Abandonment Reasons

We've put together an in-depth article on the top 10 reasons for cart abandonment and their solutions here

reasons for cart abandonment

Two key takeaways to touch on here.

First, a full 22% of respondents said that they abandoned their carts because they were asked to create a new user account. 

When you combine that with other time-consuming and frustrating tasks from the user's point of view (literally labeled "Long and Confusing Checkout" in the survey), you can reduce your abandonment rate by 31% by simply streamlining your checkout process!

Second, some customers simply abandon carts because they are comparison shopping.

While you won't be able to prevent these visitors from shopping other stores, it does stress the importance of implementing cart recovery campaigns to get back in touch with prospects and distinguish yourself from your competitors.

Other Types of Shopping Cart Abandonment

While this article has focused on shopping cart abandonment, there are many other abandonment points that you should consider.

Form Abandonment

Form abandonment occurs when customers begin filling out fields in a form, but for some reason decide to leave before completing.

These forms could be for free products such as newsletters, more information such as a free demo request or price requests, or online applications.

In general, the longer the form, the more friction customers experience, and the greater possibility that they will not fill out the form.

Form Abandonment

Browse abandonment is a higher level form of abandonment. Sometimes, shoppers clearly engage with a product category, viewing multiple products, zooming in on pictures, and comparing prices without placing a product into a cart.

Browse abandonment refers to customers who show this level of engagement, but leave the site without either placing an item in a cart or completing a purchase.

Next Steps...

Understanding the facts is the first step in creating an effective marketing campaign to recover abandoned carts.

The next step is understanding why your customers are not deciding to purchase.

We've ​created a number of free resources for you as you begin to combat cart abandonment.

Lastly, if you are looking for a complete solution to cart abandonment, schedule a quick talk with one of our cart abandonment experts. We will be able to share how Barilliance has helped hundreds of retailers maximize their traffic.

Good luck!

The post Complete List of Cart Abandonment Statistics: 2006-2018 appeared first on Barilliance.

Top 10 Reasons (and solutions) for Shopping Cart Abandonment

$
0
0

Without understanding why customers abandon carts, it is impossible to reduce cart abandonment.

We've collected the top 10 reasons for cart abandonment. We'll be breaking down each cause in detail, and provide a quick overview of how you can eliminate cart abandonment and recover sales.

This article is part of Step 1 in our
Complete Cart Abandonment Guide.

Free Resource (no opt-in): Our complete data-driven roadmap to reduce shopping cart abandonment. Click here to view.

Note: This post has been updated to reflect the current top reasons for cart abandonment in 2018. 

Top 10 Reasons for Cart Abandonment

Cart abandonment is a problem. The average eCommerce store loses over 75% of its sales to cart abandonment. Some industries experience average cart abandonment as high as 83.6%. 

Given that cart abandonment is such a problem, it is no surprise that there have been countless studies as to why visitors add items to their cart just to leave your site without making a purchase. 

Two of the most cited resources are below. 

reasons for cart abandonment

Source: Statista

Understanding why your visitors abandon carts.

Looking at both studies gives us incredible insight as to how you can eliminate cart abandonment.

The first study only asks what the primary cause for abandoning is. 

Meanwhile, the second study asks what all the reasons are for cart abandonment. 

We can now rank cart abandonment causes by both probability (how likely will your visitors be effected) and impact (how much does this cause matter).

Cause

Probability Rank

Impact Rank

Unexpected Shipping Costs

1

1

Having to create a new account

3

2

Was just conducting research 

2

3

Concerns about payment security

7

4

Long and Confusing Checkout

4

5

Couldn't find a coupon code

N/A

6

No express shipping

8

7

I couldn't calculate payment upfront

5

N/A

Website had errors/crashes

6

N/A

Return policy wasn't satisfactory

9

N/A

Credit Card was declined

10

N/A

1. Unexpected shipping cost

Probability Rank: 1

Impact Rank: 1


Hidden costs are the primary reason your visitors leave without purchasing, ranking first in both probability and impact.

25% of customers specifically cited shipping costs as the primary reason driving them away.

However, you should also pay heed to other hidden costs such as taxes or required complementary items which have a similar effect.

These costs cause an immediate annoyance and irritation. In some cases, it can even propel consumers to feel remorse for purchasing.

The solution??

Fully disclose costs. Transparency is valued highly by digital shoppers, and is crucial for store success.

The best course of action is to state all costs from the outset.

Another successful strategy is to bundle the extra cost of shipping into the product and offer "free" shipping to the customer. CPCstrategy found that free shipping is deemed "critical" to 73% of customers to make a purchase and will encourage 93% of shoppers to buy more online.

2. Having to create a new user account

Probability Rank: 3

Impact Rank: 2


Your customers expect convenience. Customers want to do things quickly and have instant results.

Spending more time and effort than expected is a significant source of friction. 22% of cart abandoners do not complete their purchase when they are required to create a new user account, and 28% of all shoppers say that it is a reason why they've abandoned carts.

The solution??

To state the obvious, don't force first time buyers to create an account before they can complete their order. Offer guest checkout.

Additionally, take some time and identify other points of friction in the checkout process that may be causing customers to spend more time and effort.

3. Conducting research to buy later.

Probability Rank: 2

Impact Rank: 3


Some cart abandonment is impossible to eliminate.

eCommerce web behavior evolves. One online shopping habit is to use the internet to browse multiple products across shops. Research includes looking into the price, quality, shipping, and special offers.

Often, customers will add items to a cart in order to easily reference items. It is not uncommon for customers to exit a store with the full intent of coming back. In fact, many will return several times before making a purchase.

The solution??

While there isn't any solution per se to reducing this type of cart abandonment - you can do better.

The point of reducing cart abandonment is to recover lost sales. If you know shoppers are evaluating certain products on price, you can implement a price match guarantee pop-up to ensure customers ultimately purchase from you.

This line of reasoning extends to other types of guarantees, such as durability, quality, or money-back offers.

4. Concerns about payment security

Probability Rank: 7

Impact Rank: 4

Payment security is the first cart abandonment reason that has a major disparity between it's probability and impact rating. 

It makes sense. 

When you are concerned about security, it has a dramatic effect. 

Major causes for suspicion include design flaws, outdated layouts, missing images, and no SSL certificate.

The solution??

There are many ways you can increase trust on your site. 

The easiest method is through various forms of social proof to assure customers that you are a trustworthy store. 

Use customer testimonials. Use product reviews. Use endorsements. Provide full contact information, such as a phone number and even faces and bios of you and your workers.

All of these factors let your customer know they are working with a real person who cares about their experience and will take care of their personal information.

5. Long and confusing checkout.

Probability Rank: 4

Impact Rank: 5

This top 10 reason for cart abandonment is similar to number 2 (creating a new user account).

Long and confusing checkout processes are annoying to customers. Oftentimes, unnecessary forms contribute to unease and can even become confusing. All of this contributes to a poor experience, resulting in 28% of shoppers to abandoning their carts.

The solution??

Minimize form elements. Only ask for necessary information.

Additionally, streamline your site's navigation. Reducing the "number of screens" from initiation to completion is a great way to reduce time.

6. Couldn't find a coupon code.

Probability Rank: N/A

Impact Rank: 6

Some customers chase deals. If they can't find a coupon or promotional codes, they will go and look for one elsewhere.

According to Statista, a full 8% of customers cite not being able to find a coupon code as the primary reason for abandoning their cart - opting instead to  wait until one shows up and try and find a better deal elsewhere.

Unfortunately, some checkout processes encourage the feeling of missing out. This happens most often when a coupon code search bar is near the checkout. The presence of this field promotes the idea that they are paying too much.

The solution??

It is best practice to auto-apply coupons when able.

Most carts have the ability to pass through parameters through the URL, and can be applied via emails or pop-ups.

7. No Express Shipping Available.

Probability Rank: 8

Impact Rank: 7

If you haven’t noticed yet, customers care a lot about shipping.

While the cost of shipping is a top reason for cart abandonment, speed of shipping poses a significant threat to large purchases.

We all procrastinate (well, 95% of us according to Pies Steel, human resource professor). Important purchases are often time constrained. Think of birthdays, anniversaries, holidays, or emergencies.

If your store is unable to deliver the goods in time, customers are forced to abandon their carts.

The solution??

The tragedy is that in all of these cases, customers are willing to spend more.

If you need to charge more for express shipping, do so. Customers are more willing to spend for expedited shipping, and you will benefit greatly from providing this option.

8. Website had errors/crashes

Probability Rank: 6

Impact Rank: N/A

The rest of these cart abandonment causes do not rank in the impact study performed by Statista. 

However, that does't mean that these issues should be ignored. Website errors, crashes, and load times are major deterrents to completing purchase, and contribute to a sense of insecurity on the site. 

The solution??

Focusing on the customer experience is paramount. 

Make sure that you are regularly going through your site, from home page to checkout, ensuring that your site is still up to date and there are no issues. 

You should perform these checks across a variety of screen sizes, especially as mobile continues to grow in importance

You can check site speed through a number of free services. We most often use Pingdom and Google Pagespeed Insights. 

9. Return Policy Wasn't Satisfactory

Probability Rank: 9

Impact Rank: N/A

Up to 66% of shoppers say that they would spend more with a generous return policy.

Unfortunately, many stores put hard limits on their returns. This can take two forms. First, policies that restrict too much time. Second, policies that charge for the return, usually in the form of shipping.

The solution??

Make sure you are able to track the number of returns and costs associated.

Then, begin offering a free, 30 day shipping. Run the test for a month or two and see what lift, if any, occurs for your industry and demographic. Compare this to the added costs of such a policy, and see if free 30 day return is a profitable strategy for you.

10. Credit Card Was Declined

Probability Rank: 10

Impact Rank: N/A

Nothing really to say here..., so we're going to throw in an extra reason that pops up fairly often.

Bonus #11: Lack of Customer Support

Probability Rank: N/A

Impact Rank: N/A

Lastly, lack of support is detrimental to shopping cart abandonment rates.

Customers expect service and convenience. A study conducted by LiverPerson found that 83% of online shoppers want help while they are on site. Over half (51%) said that they are more likely to make a purchase if they had customer support such as live chat during the session.

The solution??

How can you provide more support throughout your shopping experience? If you do not offer live chat, experiment. Like the 30 day free shipping, invest in the technology for a month or two. Measure lift in sales.

Bonus Case Study: Why Shoppers Abandon Carts Video

While conducting research, we found a great, in-depth case study on Zara. Zara is one of the leading brands in the world, and they have taken great measures to protect themselves against abandoned carts.

The video is below. Watch it for a real life walk through on how to actively combat cart abandonment and eCommerce best practices(click here to view in Youtube).

Next Steps...

Knowledge is the first step.

Action is the next. Perform an assessment (or assign to a team member) on how your site performs. While it is impossible to completely eliminate shopping cart abandonment, you can greatly decrease it by addressing these top 10 reasons.

Then, check out the full Guide on Cart Abandonment here.

The post Top 10 Reasons (and solutions) for Shopping Cart Abandonment appeared first on Barilliance.

5 Easy Steps: Track Shopping Cart Abandonment Rate in Google Analytics

$
0
0

This is an in-depth, step by step instruction manual on how to measure shopping cart abandonment rates in Google Analytics. The truth is, the process to set up tracking is easy (and free) through Google Analytics.

Unfortunately, many eCommerce stores fail to track one of the most important metrics for profit: shopping cart abandonment rate.

Free Bonus (no opt-in): This article is actually part of our larger, complete guide to cart abandonment. Click here to view. 

Why you should care about cart abandonment

The statistics on cart abandonment are not good. The average eCommerce store loses over 77% of sales that are initiated.

We covered the most common reasons for this in Step 1 of Cart Abandonment Roadmap. For an overview, you can find the
article here.

However, reading that article is not enough.

Why?

Because your store is unique. Your customers are unique. Your market is unique.

In other words, you need data specific to you. For that, you need to track cart abandonment on your site.

Recover Sales with Google Analytics

By mapping your conversion funnel in Google Analytics, you can pinpoint exactly where customers are deciding to leave your store.

To measure the shopping cart abandonment rate, we will be utilizing two advanced features in Google Analytics - Goals and Funnels.

How To Design Your First Funnel

Creating A Funnel in Google Analytics

Funnels are simply the steps leading up to a purchase.

In Google Analytics, goals can be set for each step. Once you define a goal, Google Analytics allows you to track the number of conversions (times the goal was completed), conversion rate (the percent of total visitors who completed the goal), and even segment your customers to view only those who complete a certain goal.

Kissmetrics has an excellent, in-depth article that breaks down funnels in Google Analytics. If you are unfamiliar with the concept of mapping your sales process and tracking user behavior on your website with Google Analytics, I highly recommend you set aside 30 minutes and give the article a read.

​5 Steps to Track Cart Abandonment in Google Analytics

There are five general steps in setting up a funnel to track shopping cart abandonment.

For this walk-through, we will be going over a simple checkout process, where after a sale is completed the customer is directed to an order confirmation page.

We will use this order confirmation page as our goal.

The funnel will be the various URLs a prospect must go through before they are able to make a purchase on our eCommerce store.

For the sake of this example, we will truncate the funnel to start at the cart page (where they are redirected after they place an item in the shopping cart).

Please note that you must have administrator permissions for the Google Analytics account before you can create your funnel.

Step 1: Navigate to Goals Tab

Click on admin, select your profile, and click on the "Goals" tab.

Step 2: Name Your Goal

Enter a simple, descriptive name for the Goal. In this example, we'll simply name the goal "Cart to Purchase".

Step 3: Choose Goal Type

For the Goal Type, select URL Destination. Enter the URL of your order confirmation page.

Step 4: Define the Funnel

​Next, check the "use funnel" checkbox to add the necessary steps preceding this goal.

In this case, our goal is a completed order. Before a customer is able to complete an order they must add a product to their cart. As you can see in the screenshot below, we now have two steps in our funnel.


Step 5: Save your Goal

That's it!

Depending on the amount of traffic your store receives, it could take anywhere between a couple of hours to a couple of days to see meaningful data.

Calculating Cart Abandonment With Your New Funnel

Google Analytics automatically calculates conversion rates for each goal.

We can easily see the shopping cart abandonment rate by using the Funnel Visualization page.

Here, we can see that we have a 43.66% funnel conversion rate. To get the shopping cart abandonment rate, we take 100% - 43.66% to get at a final number of 56.34%.

Next Steps

If you haven't created a funnel to track shopping cart abandonment, do it now.

I highly recommend setting up specific funnels for particular products or product categories to get more granular and actionable data.

The next step is to begin building a strategy to reduce shopping cart abandonment and recover sales.

For that, I encourage you to begin Step 3 of our
Shopping Cart Abandonment Roadmap.

The post 5 Easy Steps: Track Shopping Cart Abandonment Rate in Google Analytics appeared first on Barilliance.


[Case Study] 17 Omnichannel Strategies and Tactics Breakdown

$
0
0

Omnichannel retailing isn’t new. But the truth is …

Most retailers are failing at creating successful omnichannel strategies.

Despite the vast majority (90%) of brands having an omnichannel strategy in place, only
8% feel like they are succeeding.

This omnichannel case study is going to break down one of the most successful retailers, and how they use omnichannel marketing to drive revenue.

Read on to learn the real strategies and tactics Nordstrom uses across the three main components of any omnichannel strategy:

  • Personalization - Understanding your customer enables you to personalize each touchpoint across devices and locations. 
  • Fulfillment - Connecting offline and online channels through fulfillment provides an incredible convenience to customers and sales uplift and brand loyalty.
  • Customer - You need to collect and connect customer behavior, demographics, product/category affinities, and purchase history across all channels in one place.

How Nordstrom Personalizes Customer Experiences With Omnichannel Marketing

Nordstrom has long been a leader in Omnichannel retailing. Underpinning their strategy is an extreme focus on what has always distinguished Nordstrom: superior customer service, convenience, and understanding customer wants.


Omnichannel marketing means being where your customers are. It requires the active management of multiple channels to drive sales, and systems to support personalized engagements.


Our customer strategy focuses on providing a seamless and high-quality experience across all Nordstrom channels. - Nordstrom 10k, 2016

Omnichannel marketing means being where your customers are. It requires the active management of multiple channels to drive sales, and systems to support personalized engagements.


These first few examples show how Nordstrom personalizes the customer experience based on intent - connecting social discovery and eCommerce fulfillment seamlessly.

Connecting Social to Brick & Mortar

Using Pinterest to Supercharge Discovery and Drive Retail Traffic

Omnichannel social strategies

Since 2013, Nordstrom has integrated Pinterest directly to their stores. They first did this by highlighting their most popular items on Pinterest with in-store displays.

In 2018, Nordstrom is taking their Pinterest game to new levels.

Pinterest recently released a new "Pincode" feature, which allows shoppers to scan a code and be taken to a Pinterest board.

This gif made by the Pinterest team shows exactly how it works.

  • Nordstrom shoppers scan the Pincode while in-store
  • Shoppers are taken to an curated board of gifts under $100
  • Nordstrom sell more

​You can see the actual board Nordstrom uses here.

Using Youtube to Extend Customer Service

In-store, Nordstrom associates are able to guide clients to the purchase purchase with their expert style advice.

With video, Nordstrom is able to recreate this type of customer service online. In fact, video has become key for educating and motivating clients on how to put wardrobes together.

The final call to action is perfect.


It underlines the shortcomings of a video, and invites the customer to come in and talk to their own personal style expert.

Nordstrom connecting Social to Instore

Connecting Social to Online Stores

Nordstrom also uses social to drive online sales.


One example is through Instagram's Shoppable Posts. Mary Beech, EVP and Chief Marketing Officer of Kate Spade explains:

Traditionally, our customer had turned to Instagram for inspiration, and we're seeing that she's reacting positively to the new shopping experience, which allows her to seamlessly tap and shop the product - going from inspiration to information to purchase in just a few steps.

Below are some quick screenshots that illustrate the customers journey from social to purchase. 


First, Nordstrom shows the products in native Instagram posts. When they click the product, the next screen is given (still in the Instagram app). 


This screen carries more product information, as well as clear product photos that allow the customer to determine if they want to buy. Finally, when a customer clicks "Shop Now" they are brought to the online store.

Key Takeaways

Customers use social for discovery and education.

By meeting customers where they are, you can engage with shoppers early in the buyer journey with entertaining or educational content.

Extending Personalized Communication Beyond the Store

One of Nordstrom's key advantages is connecting with customers through their sales associates.

Sales associates at Nordstrom's are expected to deliver personalized product recommendations, and guide the customer through their store.

However, as customers increasingly shop online, Nordstrom's needed a way to replicate this personalized experience online. Partnering with technology company BevyUp, Nordstrom's is able to initiate (or continue) conversations with customers online, and provide the same level of personalization on mobile.

BevvyUp's partnership with Nordstrom resulted in

  • +32% - Online Conversion Rate
  • x5 - Average Online Order Value
  • -50% - Store Return Decrease

The partnership was so successful that Nordstrom decided to acquire the company, and fully integrate it into their own employee app coming out in late 2018.

Other Personalization OmniChannel Marketing Tactics  Used

 I want to quickly list a few other ways Nordstrom personalizes their interactions with their customers.


Personalized in-app communication


Loyalty Programs - Loyalty program that rewards shoppers points regardless of where you complete the purchase.


Congruent Experience Across Devices 


How to fuel Omnichannel Retailing with Cross Channel Fulfillment

Nordstrom recognizes that in order to succeed at omnichannel, they must support fulfillment across all of their channels.

Again, their guiding principle is convenience and customer service.

As Brian Gill, the technology senior vice president explains -

"The retail environment is changing faster than ever, but the value of service, speed, convenience and newness remain constant,"

"The retail environment is changing faster than ever, but the value of service, speed, convenience,, and newness remain constant." - Brian Gill

Connect your offline and online worlds with your store app

Nordstrom in app purchase

In 2016 Nordstrom added a "Reserve and Try in Store" feature for their in-app shoppers.

Nordstrom shoppers often look up products before going in-store to try products on and purchase. With this feature enables, Nordstrom allows customers to place items "on reserve".

Nordstrom completley nails the execution.

Once a store clerk has collected the reserved items and placed them in a dressing room with the customers name attached to the door, a simple text message is sent, letting the shopper know their reserved items are waiting for them.

Items are kept until the store closes the next day.

Evolve your business model to fit customer expectations

The most successful digital first retail stores are beginning to open phsycial space retail stores.

Warby Parker operates upwards of 63 stores. Likewise, Bonobos and Moda Operandi have already opened their first physical stores.

Nordstrom is taking notice and action.

Their latest effort is opening a store where the merchandise is on display but you can't take it home.

  • No inventory
  • Delivery Only
  • Onsite Tailoring
  • Full service Drink Bar
  • Nail Salon

While the average department store spans over 140,000 square feet, the first Nordstrom Local came in right at 3,000.


Keeping in line with their omnichannel strategy, the boutique supports returns of online purchases and curbside pickup of online orders.  The store also highlights what distinguishes Nordstrom from its competitors: service.


In this case, a full service bar is offered where shoppers can receive personal advice from a professional stylist - not to mention enjoy the other drink and nail care amenities.

Other Omnichannel Fulfillment Tactics Used

In addition to these omnichannel fulfillment strategies, Nordstrom utilizes a number of  other tactics including:

  • Cross channel inventory - Store inventory is shared across all channels
  • In-store inventory online - Physical store availability is able to be seen online
  • Curbside Pickup - Shoppers can purchase online, drive to a store, text an associate, and have their cart ran from in-store to car-door.
  • In-store purchase w/ Home Delivery - In reverse, shoppers can enjoy in-store customer service, make a purchase, and opt to not carry around bags as they continue shopping.

Connecting Data Across Brands and Platforms

Powering all of Nordstrom's omnichannel strategies and tactics is the ability to unify customer data. 

Data fuels omnichannel strategies and tactics. The goal is simple: get all of your customer data in one place, make that data easily accessible, and use that data. 


Free Resource (no opt-in): Click here to see the key data questions you need to ask to empower your omnichannel strategy. 

Like most retailers, expanding sales channels has been a major fulcrum of growth for the company. As the number of channels retailers use increase, so does the complexity and the need for data unification. 


Today, retailers use a number of channels including:

  • Multiple websites 
  • Physical Stores - Digital first brands such as Bonobos are launching physical stores. ​​
  • Wholesale - Increasingly, wholesale first customers are beginning to build relationships directly with consumers, while retailers have always expanded to wholesale once they reach scale.​​
  • Mobile/App - Mobile conversion and traffic stats continue to grow.
  • Telephone Orders
  • Social Marketplaces - eBay, Facebook Marketplace, and chat marketplaces. ​​

Nordstrom's Many Sales Channels

Like most established retailers, Nordstrom's uses a multitude of sales channels to connect with customers.


What separates Nordstroms (and makes their quest for omnichannel success that much more difficult) is the number of distinct brands the business manages.


As of March 20th, 2017 - Nordstrom operated 344 US stores and three major eCommerce platforms: Nordstrom.com, Nordstromrack.com/HauteLook, and TrunkClub.com.


While the majority of their retail stores fall under two brands (Nordstrom and Nordstram rack), they also operate Trunk Club clubhouses, Jeffery Boutiques, and "Last Chance". 


In addition to their eCommerce stores, Nordstrom also has a whole suite of customer facing apps where customers engage with the brand and complete orders. 


All in all - Nordstrom's sales channels include

  • Three Major Brands 
  • Physical Stores - 344 stores in the US
  • eCommerce Stores - 3 total, one for each brand.
  • Social Channels - A multitude of social channels for each brand including Pinterest, Instagram, Youtube, Facebook, and others.
  • Mobile Apps - 3 total, one for each brand.

Connecting Customer Data

Despite this complexity, Nordstrom is able to connect customer data - creating a seamless experience even across brands.


Nordstrom unifies customer data across  all of these brands and channels. Customer preferences, sales history, and information are stored in the same account - accessible by each brand and customer.


In other words, if a customer shops at Nordstroms, and then Nordstrom Rack, that information is kept together.

​Other Omnichannel Data Unification ​Tactics

This fundamental ability to combine customer data empowers all of the omnichannel personalization and fulfillment strategies. 


Additionally, there are a few data unification tactics that Nordstrom uses to enhance the customer experience.

  • Cross channel returns and exchanges 
  • Save preferred store

Next Steps...

Creating an effective Omnichannel strategy is not easy. 


The first step is getting your data together in one place, and selecting a personalization vendor that empowers you to build seamless, personal, customer experiences across platforms and devices.


We've put together an in-depth guide on how to select a personalization partner here


If you're interested to see how Barilliance can help your brand, you can request a demo here.

The post [Case Study] 17 Omnichannel Strategies and Tactics Breakdown appeared first on Barilliance.

2017 Email Marketing ROI Statistics: Open Rate to Revenue

$
0
0

Unfortunately, most studies on email statistics are limited to open rates, click through rates, and bounce rates.


But for most of us, the ultimate KPI for eCommerce email campaigns is profitability.


This study, conducted over two years from 2016-2017 across hundreds of eCommerce sites and millions of emails, illustrates the entire email marketing funnel - from open rate to conversion. 

Summary: Top of Funnel Email Stats

Year

Open Rate

CTR

CTOR

2016

44.22%

8.31%

18.78%

2017

45.59%

8.69%

19.06%

Summary: Email Conversion Stats

Year

CR (Sent Base)

CR (Click Through Base)

Highest Total Rev. Email Type

Highest AOV/Email

2016

44.22%

8.31%

Shopping Cart Abandonment

Email my Cart

2017

45.59%

8.69%

Shopping Cart Abandonment

Email my Cart

Average Email Conversion Rate Statistics

Challenges with Conversion Rates

Email conversion rate is a nuanced metric. 


There are a variety of end goals that your email may want to achieve - from capturing leads, to soliciting a response, to completing a purchase.


Because this study focused on eCommerce sites, we defined a conversion as a completed purchase. 

How to Calculate Email Conversion Rate (CR)

There are three simple steps to calculate email conversion rate.

  • Define your end goal - First, you need to determine what a conversion is to you.  While we chose completed purchases, it can be anything. 
  • Define your base - Second, you need to decide what base makes more sense to you. Should you base your conversion rate on all sent emails or as a percentage of emails that succeeded in getting the prospect to click through?
  • Calculate - Finally, calculate your conversion rate by taking the total  number of conversions in step 1 divided by your base in step 2.

Using sent emails as your base will result in a more comprehensive metric that depends on the effectiveness of your subject line, email deliverability, and email copy. 


If you choose to use the number of clicked through emails as your base, you will control for those variables, and instead focus on how effective your landing/product pages are, the strength of your offer, and how well your offer matches the segment you are emailing to. 

Average Email CR Statistics Over Time

The first thing we notice is that email remains an incredibly effective channel at driving purchases.


Here, we see that a full 17.63% of clicked through emails ultimately result in a purchase, up slightly from the 2015 CR of 17.39%.


In fact, according to Custora E-Commerce Pulse, email accounted for 19.8% of all transactions - trailing only paid search (19.9%) and organic traffic (21.8%).

Email accounted for 19.8% of all transactions - trailing only paid search (19.9%) and organic traffic (21.8%) - Custora E-Commerce Pulse

When calculated as a percentage of total emails sent, the conversion rate drops significantly.


This, in part, illustrates how various email statistics interact and influence each other.


When you are able to create effective, personal subject lines that compel prospect to open their emails, the chance that they click through and convert is very high.


In other words, conversion rates depend on open and click through rates.

Average Email Conversion Rates by Campaign Type

Segmenting by campaign type reveals how effective engaging customers across all levels of intent is. 


While browse abandonment only converts at 3.83%, it is still a substantial improvement over not having this type of prompt and engagement.


However, once customers have demonstrated purchase intent by placing items in a cart, emails convert at a substantially  higher rate.

  • Browse Abandonment Emails: 3.8% - Lowest form of intent, recovering 3.83% of sales.
  • Email my Cart Emails: 22.73% - High form of intent - may be leaving to comparison shop or simply in the research phase of purchase.
  • Cart Abandonment Emails: 18.64% - Maximize conversions by addressing one of the top reasons for cart abandonment.

Limitations of conversion rate metrics

Email conversion rate is one of the best "macro" KPIs that you can select.


While some prefer to focus on overall profitability or ROI, the truth is not all of your customers are going to be big spenders. 


With proper segmentation, you can (and should be) optimizing for both overall revenue and ROI. The problem is that in isolation, your conversion rate is not very prescriptive. How to increase your conversion rate is impossible to tell from this metric alone.

This is why it is imperative that we look to the "
micro-conversions" leading up to purchase. 

How to Improve Email Conversion Rates


There are two main ways to improve conversion rates.


First, you can improve how personalized your offer is through proper segmentation and omnichannel strategies.


Second, you can improve the mechanics of the offers themselves (implementing best practices such as send times, optimal subject lines, etc). 


Email Marketing ROI Statistics

Email marketing has always been a high ROI channel for eCommerce. This section will break down the highest revenue generating email types.

Revenue Generated Per Email

By far the most effective type of triggered email are Email My Cart campaigns.

These emails created 54.9% more revenue per email than the second highest converting campaign type (cart abandonment emails), and 168% better than the average. 

Back to stock and post-purchase emails proved to be much less effective than the other campaign types.

One lesson from this is the importance of timing, and engaging customers right when they are most likely to purchase.

Other Email Marketing ROI Statistics

The Data & Marketing Association has identified a number of key email marketing statistics. 

  • Average ROI - 3,800%, or $38 for every $1 invested
  • Top Performers- 18% of companies achieve ROI greater than $70 per $1 invested
  • Low Performers- 20% of companies achieve ROI less than $5 per $1 invested
  • Segmented Emails- Generated 36% of total email revenue
  • Triggered Campaigns- Generate 306% more click throughs per email than non-triggered emails. 


Email ROI Takeaways 


There is a massive difference between low and high performers in email marketing. While high performers achieve $70+ per dollar invested, low performers are recognizing gains of less than $5 per dollar invested. 


To maximize email marketing ROI, focus on email personalization, triggered email campaigns, and implementing email capture strategies such as email my cart and browse abandonment. 


Average Email Open Rate Statistics

Email open rate is a base metric provided by every major email service provider.


It is a great "top of the funnel" metric for eCommerce email marketing campaigns.  

Challenges & Limitations of Email Open Rates

As we will see, open rates vary dramatically across campaign types.


Win-back campaigns by nature are going to have much lower engagement metrics than cart abandonment emails. That doesn't make win-back campaigns useless - far from it.

Because different email types have vastly different expected open rates, average email open rate statistics are relatively useless. 


Note: the same applies to all other email statistics: CR, CTR, CTOR, AOV, etc. When able, look to compare similar campaign stats.


Further, using open rate as your main KPI doesn't make a lot of sense.


If you focused on only maximizing open rate, you would only send to those customers most likely to engage with your messaging (for example, your “best” and “loyal” customer segments in an rfm analysis).


That being said, open rate is a very valuable metric to gauge the effectiveness of your subject line, relationship with your audience, and quality of your offer.

How to Calculate Email Open Rate

Open rates are one of the easiest metrics to track.


Email open rates are calculated by taking the total number of opened emails and dividing it by the total number of sent emails.


As mentioned, most ESP providers will be able to provide this data for you at both an aggregated and per campaign level in their dashboard. 

Average Email Open Rate Statistics Over Time

Our study compared email open rates from 2016-2017. 


We found that like conversion rates, open rates increased slightly over the years. In 2017, email open rates reached an incredible 45.59%!

Average Email Open Rates by Campaign Type

There is a huge variance in open rates across the most popular campaign types. 


"Back in Stock" emails had the highest open rate (65.32%), performing almost 70% better than the lowest performing email campaign type of post-purchase emails.


Like conversion rates, "email my cart" triggered emails performed extremely well, and markedly better than the lower intent browse abandonment email.


Shopping cart abandonment emails performed in line with other published shopping cart abandonment email statistics.

How to Improve Email Open Rates

The single most immediate way to improve your email open rate is to improve your subject line.

We’ve covered the best types of cart abandonment email subject lines here.  


After you improve your subject line, you can focus on building relationships with your user base through regular, valuable communication. Look at your own inbox. Which emails do you read religiously and which do you auto-delete?


Lastly, in addition to the strength of your subject lines and past relationships with clients, timing matters.


It is interesting to note that open rates from our database are significantly higher than other more general platforms.


For example, in Mailchimp's latest Email Marketing Benchmark Report, they broke out a variety of email open rates by industry. 

Industry

Open Rate

Beauty and Personal Care

18.48%

eCommerce

16.75%

Retail

20.96%

Why is this?


First, and most importantly, many of Barilliance's triggered email campaigns are set off when customers express interest in a product. This allows eCommerce stores to send highly relevant emails at the exact time of consideration.


Second, many of our clients utilize personalization in their subject lines, injecting product names that customers either added to their cart or simply spent the most time on.


The lesson is to maximize engagement by capturing contact information and automating personal, relevant messages to continue the education and motivation process. 

Email Open Rate Take-aways


Email open rate is best used to evaluate the relevancy of your offer to the specific segment you are communicating to, the effectiveness of your subject line, and your overall relationship with your audience. 


To improve your open rate, focus on email subject line best practices, personalization through segmentation and product recommendations, and timing emails to clients actions.  

Average Email Click Through Rate Statistics

Email Marketing CTR Statistics

Like open rates, email click through rate (CTR) is a basic metric that is easily assessable through most professional email providers.


It is a fantastic metric to evaluate your emails message and offer. 

How to Calculate Email Click Through Rate

The standard definition of email click through rate is to take the total number of visitors who clicked through on the email (usually a link within the email to a website page) divided by the total number of sent emails.


However, recently another form of CTR is gaining popularity.


Instead of using the total number of sent emails as the base, it uses the total number of opened emails.


This "new" click through rate is called click to open rate, or CTOR.


While some calculate email click through rate by the total number of sent emails, I prefer to use the number of opened emails.


CTOR is a narrower metric which focuses on the quality of the email body, and controls for outside variables such as subject line and delivery.

Average Email CTR Statistics over Time

As with conversion rate and open rates, 2017 slightly outperformed 2016 across both CTOR and CTR.


It is interesting to compare these numbers to industry averages. Constant Contact has a great Industry Comparison Chart that breaks down both open and click through rates on a wide range of industries. 

Industry

Click Through Rate

All industries -Overall Average

8.00%

Retail (both brick and mortar and online)

7.53%

These numbers are dramatically higher than industry studies compiled by Mailchimp.

Industry

Click Through Rate

Beauty and Personal Care

1.96%

eCommerce

2.32%

Retail

2.50%

Regardless of which industry benchmarks you use, there is a substantial difference between our database numbers and these figures.


Our database shows a 15.4% increase over Constant Contact's industry average and 275% increase over Mailchimps.


Like open rates, this difference can be attributed to the high percentage of triggered emails in our database, segmentation best practices, and personalization techniques embedded within the email.

Average Email CTR Statistics by Campaign Type

By far the highest converting email type was email my cart campaigns. These emails resulted in click throughs 39.42% of the time, 101% more often than the second highest campaign type (cart abandonment - 19.6%).


After email my cart campaigns, the rest of the field performed much closer to each other. 

The lowest click through rates came from post purchase and browser abandonment emails.

How to Improve Click Through Rates

Your email click through rate depends entirely on how well your offer is crafted for each individual recipient.


One key to success is to leverage personalization throughout your email copy and ultimate offer. A study published by Aberdeen shows that personalization increases CTR by 14%.


Our own studies show that using dynamic product recommendations within your email communication can increase email click through rates by 35%!


Lastly, you can further personalize your messages by triggering emails based on user's actions. We've cited numerous examples in this study, such as "email my cart" and "browse abandonment" triggers for visitors who are shopping but not converting.

Next Steps...

Use these email marketing statistics to benchmark your own ROI and conversion metrics.


Then, make sure you are implementing the most effective email types:

  • Email My Cart and Browse Abandonment - Engage and capture email addresses of visitors who engage with content but don't have an account. 
  • Cart Abandonment - Recover sales with effective, triggered cart abandonment campaigns.
  • Dynamic Product Recommendations - Increase relevancy with personalized subject lines and email content.

To learn how Barilliance empowers eCommerce and retail brands execute these strategies (and more), request a demo here


The post 2017 Email Marketing ROI Statistics: Open Rate to Revenue appeared first on Barilliance.

Ropo Effect Statistics and 9 Ways to Increase Sales

$
0
0

Customers want to make informed decisions.

In fact,
88% of shoppers research online before making a purchase.

This customer behavior, known as ROPO (research online, purchase offline) presents a HUGE opportunity in eCommerce. This post will break down exactly what ROPO means, and 9 strategies you can use to take advantage of the ROPO effect.

What Does ROPO Mean?

ROPO stands for Research Online, Purchase Offline. It refers to a documented customer behavior where customers consult online sources such as reviews, eCommerce stores, and expert opinions before purchasing in-store.

ROPO Effect 2018: Stats that show online's effect IRL

Understanding the ROPO effect is like putting together a puzzle.


At first, it seems strange that customers wouldn't complete their purchase in one place - whether online or in-store. 


But when all the pieces are together, it is obvious why customers research digitally and purchase in-person.

The Internet has become essential for research

In 2018, Americans look to the internet as a first point of reference. According to Google, 78% of people in the United States look to the internet first when they need to research something.


A further 53% actually prefer to do a task digitally if able.


We see similar figures reported from inside the retail industry itself. According to a panel of 250 retail executives with sales over $100M, 82% say that their customers research online. 

Smartphones are Changing How We Shop

Smartphones have ignited internet adoption in all areas of life - including evaluating and shopping for products.


Google surveyed consumers and asked a simple question: Which of these did you do on a smartphone in relation to your recent purchase decision?


We see that consumers use smartphones for inspiration (scrolling through social media, flip books, and sites), educated themselves with reviews and articles, compared products across shops and completed purchases.


In another study conducted by DigitasLBi, having a smartphone changed the shopping habits of 49% of respondents. 


Consumes have always depended on social proof to make purchase decisions. Today, that social proof is online.  Yet, brick and mortar still matters.

Brick & Mortar Matters

It is easy to overlook how dominant brick and mortar stores still are. 

90% of all sales in the United States still occur face to face. 


In fact, while eCommerce is outpacing physical stores in growth rate by an impressive 13.5% (17% vs 3.5%), physical stores are growing an absurd amount more in aggregate sales volume.


That 17% eCommerce growth rate was based off of an impressive $38 Billion growth in sales. However, the 3.5% growth in physical stores resulted in an increase of $144 Billion.

Shoppers Depend on Reviews

Customers are using the internet to research all types of local businesses.


The most common way consumers do this is through online reviews.


While the most popular categories for reviews remain food and beverage, retail stores including clothing, hair/beauty, and grocery all had increased review usage rates. 

Customers Use the Internet to Shop Locally

In Bright Local's Local Consumer Review Survey 2017, they found a number of interesting stats.


97% of consumers looked online to find a local business.

12% use the internet everyday to find local businesses.


In other words, internet research is pervasive, and omnichannel strategies need to be considered for all types of businesses.

Customers Research Online Before Shopping In-Store

Our own study on omni-channel behavior revealed that shoppers specifically consult the internet before venturing out to purchase a product. 


21% browse online all the time before buying in-store.

71% browse online some of the time before they go to a physical store.


Meanwhile, only 8% of respondents said that they never research online before purchasing offline.


Customers Research Online while In-Store

Aided by smartphones, shoppers more than ever are using the internet while physically inside a store.


It is reported that online behavior influences 56% of all sales made in-store.


Shoppers regularly:

  • Compare Prices 
  • Download Coupons
  • Check Sales/Redeem Exclusive Offers
  • Scan QR Codes
  • Research Products

The bottom line is this: retailers need to adopt an omnichannel approach that integrates mobile and physical locations. Without being proactive, shoppers are more likely to take matters in their own hands and visit competitor sites.

[Case Study] 17 Omnichannel Strategies: We did a complete tear down of Nordstrom's omnichannel strategy and tactics, complete with screenshots. Check it out (opt-in free) here.

Why Customers (still) Prefer Physical Stores

There are many reasons why customers are still making most of their purchases in-store, but the two most common are related to trying the product first and shipping.

Customers Want to Try Items First

Wanting to physically touch products are the most cited reasons for preferring physical stores. 

  • 56% - Want to see and touch items before they buy 
  • 55%- Actually want to try items on and see how they fit
  • 41% - Are concerned about the accuracy of online representations of products.​​

Customers Hate Shipping

Shipping continues to be a big hurdle for eCommerce stores, and is the second driving factor for customers preferring to shop in physical locations. 


This isn't much of a surprise.


Shipping issues contribute three of the top 10 reasons for cart abandonment (including the top reason of unexpected shipping costs).

  • 34% - Don't want to wait for items to arrive. 
  • 25%- Cite too high shipping costs
  • 14% - Expressed frustrations about complicated return procedures

ROPO Challenges

There are significant challenges in creating effective ROPO marketing strategies.


The biggest challenge is tracking.

Tracking online conversions is easy. Unfortunately, tracking offline conversions that originate online is not.

Creating solid attribution techniques, and connecting your data across channels are the biggest challenges in creating effective ROPO strategies.

ROPO Marketing Strategies & Tactics

We've demonstrated that customers increasingly use the internet to guide in-store purchase decisions.

Below are several techniques eCommerce stores are using to capitalize on the ROPO consumer behavior.

Strategies to Increase eCommerce Conversion

We've covered in detail how to create effective cart abandonment strategies here

However, beyond cart abandonment, there are a number of  strategies you can put in place to position your store well during the research phase. 

Personalize Digital Touchpoints Based on In-Store Actions

You should personalize digital touch points with information you gather in-store.

A great example is cart abandonment campaigns. Normally, you would followup with customers if they did not complete their purchase on-site.

Software like Barilliance can recognize that customers bought the items they were researching online in-store, and pause cart abandonment emails and instead initiate a post-purchase campaign.

Create Research Aids

ROPO demonstrates that your customers are researching online. 

One of the best things you can do is provide value ahead of time by creating free guides that position your products well. 

Above we see an example page set up by Chubbies. Notice in the top right they directly address the two main reasons for ROPO.

Free Three Day Shipping

Free Returns & Fit Guarntee


The page goes on to call out several different gift types including

  • Gifts under $50
  • Gifts under $75
  • Gifts under $100
  • Gifts for Outdoorsmen
  • Holiday Collection

Along with a bunch of other specific call outs to help customers make the right choice. 

Strategies to ​Track ROPO ROI

Tracking customers across digital and non-digital channels remains a major challenge. 

However, investing time and thought into how you will attribute sales is important. Without measuring your digital marketing's effect on in-store purchases, you can't measure the true ROI of some of the most important marketing channels of 2018, including Facebook ads, Google AdWords, and your site's newsletter.

Connect CRM and POS with Loyalty Cards

One of the simplest ways to track customers across all channels is to use loyalty cards. 

Customers are accustomed to sharing all the details you need including name, email, phone numbers, and even birthdays. 

Once you have that data, you can pair it up with your online marketing to create personal, relevant campaigns for specific customer segments. 

Powerful Segmentation: Use RFM Analysis to quickly identify your most profitable customer segments including your most loyal, your highest paying, and even at-risk customers.


Check out our full guide (no opt-in) here.

Measure Facebook Ads ROPO Effect

Facebook recently launched a new feature that allows marketers to measure their effect on in-store purchases.

As
Facebook explains, "With offline conversion measurement capabilities on Facebook, you can track when transactions occur in your physical business location and other offline channels after people see or engage with your Facebook ads."

How it works

The goal is to match customer data to Facebook accounts, and then see if those accounts engaged with your ads in the last 24 hours, 7 or 28 days.

The most common data to match is:

  • Email
  • Phone Number
  • Name (first and last)
  • Address
  • Date of Birth

The folks at Wolfgang Digital did a great break down on the steps required to setup offline tracking. You can see their detailed step by step walk-through here.

Strategies to Build Trust & Remove Risk (desire to try products, etc.)

Create Online Fit Tests

One contributing reason for the ROPO effect is customer's desire to guarantee fit.

You can increase the customer experience and confidence by creating fit quizzes. This is especially important for clothing, where fit directly impacts comfortability and look.

Use Augmented Reality to Decrease Risk

Another way to address customer concerns is through augmented reality.

Ikea is a great example.

Whereas before customers wanted to physically go the store to get a sense of the size, they can now easily visualize how their new furniture will fit in their space with the IKEA place app.

Customers can browse through thousands of items, select which one they want, and place it right in their living room. 

​Strategies to Build Your Online Reputation

Focus Your Reviews

Your customers are likely to review you and your products on only one platform. 

To succeed, you need to select which platform makes the most sense for you to aggregate reviews on first. Typically, Google and your distribution point (your site, Amazon, etc.) will be the two you should focus on first. 

Build Positive Reviews

There are many ways to build online reviews for your site.

  • In-Person - Hand out cards after the transaction with a clear CTA to leave a review.
  • Post-Purchase Emails - Thank customers, and encourage them to help future purchasers by leaving a review.
  • Follow-up - Like most things marketing, following up works. Some studies show that up to 70% of people will leave a review if asked.

Respond to Negative Reviews

While consumers are increasingly valuing positive reviews more than negative reviews, you still need an active, genuine response to negative reviews.

It is best to speak in your brand's voice, make right with the customer, and clarify the situation.

Avoid Looking Like a Cheat

Unfortunately, many people create fake reviews. 

To avoid being penalized, it is best to set up links within your site that will redirect the visitor the the proper review platform.


-> Never use an API to gather reviews. Review sites can tell, and it will look suspicious if your reviews come from the same source. 


->Don't solicit reviews on premise. Again, if customers leave reviews while logged onto your wi-fi, it can appear that you are spamming positive reviews.

Next Steps...

Once you implement ROPO marketing strategies, you will be able to better attribute sales to marketing channels. 

Reoptimizing your ad spend is the first step. 

After that, realize that you have a huge opportunity to engage customers both before they purchase (by creating guides and tools) and after purchase (through personalized, 1 to 1 after sales emails).

We've written two key guides to help you execute these next steps.

  • Retention Marketing Strategy Guide - This guide breaks down how the most successful eCommerce stores are retaining customers through all phases of the funnel.
  • How to Select Your Personalization Partner - To create truly personalized engagements with every customer, you need the ability to dynamically customize triggered emails. This guide walks through the complexities of personalization, and questions to ask before you select a partner.

If you want to see how we help hundreds of eCommerce stores connect their online and offline channels, you can speak with an expert here.


The post Ropo Effect Statistics and 9 Ways to Increase Sales appeared first on Barilliance.

[2018 Update] Click and Collect Statistics, Challenges, and Strategies

$
0
0

In 2018 there is now compelling evidence that Click and Collect is a mandatory fulfillment model for retail and grocery eCommerce.


This guide will break down how top retailers are using Click and Click, give an overview of current consumer use, and finally share the challenges and keys to success in implementing a Click and Collect service.

What is the Click and Collect Model?

Click and Collect is an omni-channel retail strategy where shoppers order their items online and pick them up in store.


Currently, the model is more prevalent in Europe - especially France and the UK. However, as US retailers continue to become more customer centric, they are adopting click and collect functionality.


​There are three main ways companies are implementing the model.

  • Customers pickup items at a third-party location such as 7-11 or dedicated shops.
  • Designated stores are selected by customers where they can pickup items.
  • Customers pickup from a centralized click and collect hub, such as an outdoor drive through.  

Lastly, Click and Collect goes by a few other names.

BOPUS: Buy Online, Pick Up in Store

BOPIS: Buy Online, Pickup In Store


For simplicity, we'll refer to this strategy as Click and Collect.

2015 - 2018 Click and Collect Statistics

Below we have collected a number of Click and Collect statistics. I prioritized recent studies, with the newest studies coming from 2018. 

Click and Collect Market Growth

Current Market Share

72% of UK shoppers currently use Click and Collect - Cybertill & Forbes, March 2016


21% of shoppers use Click and Collect for half (or more) of their purchases - Cybertill & Forbes, March 2016


Toilet paper, Vitamins, and Laundry are the most popular items for click and collect.  - Nielson, December 2017

US Adoption and Market Growth

49% of U.S. Consumers used Click and Collect for the first time in 2016. - CNBC, January 2016


71% of US shoppers have used Click and Collect in the past 12 months - CNBC, January 2016

Click & Collect Continues to Grow

By 2025, 10% of all sales will be fulfilled by Click and Collect. In-store purchases will decline to 60%. - Post and Parcel


Larger metro areas have the highest demand for Click and Collect - FMI , Nielson, February 2018​​


Click and Collect is Growing in Grocery

In general, the US online market lags in grocery market share. Currently, online CPG sales account for only 1.5% of total sales. 

However, Click and Collect has already emerged as the major fulfillment model for perishable goods.


In France, Click and Collect (known as Click and Drive) already accounts for 5% of the countries grocery sales, and is expected to reach 10%.

As convenience becomes more important in the competitive landscape, Click and Collect is becoming the top focus of top grocers.

Kroger recently celebrated it’s 1,000th click and collect grocery shopping service - Progressive Grocer, December 2017

We plan to expand our seamless service to more markets, ultimately making this convenient shopping experience available to every one of the 60 million families who shop with us. - Yael Cosset, Chief Digital Officer Kroger

Kroger's program is known as ClickList. 

In fact, every major grocery player in the US, from Wal-Mart to Safeway are investing in click and collect infrastructure.

Click and Collect Grocery Statistics

US online grocery spending will reach $100B by 2023 - FMI, Nielson, February 2018


Millennials prefer to use click and collect/curbside pickup more than delivery for groceries, FMI, Nielson, February 2018


Percentage of grocers offering click and collect programs grew 53.3%, from 15% to 23% in 2016, Food Drive, April 2017

Click and Collect is Growing in Retail

US retail giants are investing heavily in click and collect through a myriad of efforts.

Acquisition has been a major trend, highlighted by Target's recent target Shipt. While the acquisition gives Target the ability to fulfill same day delivery, it also gives it a greater capability to overcome inventory challenges associated with Click and Collect.

Retail Chains are Expanding Click and Collect Efforts

Target plans to expand Click and Collect service “Drive Up” to 1,000 stores by end of 2018 - Progressive Grocer, April 2018

WalMart to add another 1,000 stores to its curbside pickup program by the end of 2018. - CNBC, December, 2017

The Click and Collect Experience: Why Customers are Demanding Convenience

We've covered the shortcomings of the eCommere experience before with ROPO (Research Online, Purchase Offline).


In that article, we shared how Brick and Mortar sales still account for 90% of all sales.  Shoppers want the ability to see and touch items, and ensure that items fit. 


Click and Collect combines the best of eCommerce and traditional retail. 

Benefits of Click and Collect to Shoppers

Below are the most often cited reasons customers give for using click and collect services.

  • Save on Shipping Costs- Customers can bypass shipping costs by picking up their items at the store.
  • Speed of Fulfillment- When customers need to get the item ASAP, they are often able to pickup in-store on the same day.
  • Convenience- Customers are beginning to leverage Click and Collect to expedite their shopping. This is especially true for grocery and fast moving consumer goods such as toilet paper. 
  • Assurance- Two of the biggest challenges with online shopping is assuring fit and discerning product attributes like feel and texture.  Completing the purchase in-store allows customers to inspect the product before committing to purchase.

Of all the reasons, the most often cited is speed. According to the latest study by conducted by Bell Howell, 88% of respondents cited speed as a reason for using click and collect.


Shipping costs were the second most cited reason, with 76% of respondents noting it.


It is interesting to note that many of these reasons correlate to the top reasons shoppers abandon their eCommerce carts.


-> Unexpected Shipping Costs

->No Express Shipping Available

-> Return Policy Wasn't Acceptable


Click and Collect solves all of these issues with cart abandonment, and is a major reason retailers are investing in Click and Collect.

Increased Use and Importance in Holiday Season

Knowing how Click and Collect helps consumers, it is easy to see why demand and usage for the service increases during holiday seasons like Black Friday and Christmas. 


Speed is crucial for last-minute shoppers. They need to take control of the timing. Many cannot afford to wait even a day for their deliveries to be made. 


The store itself is packed, making it unpleasant to some consumers. WalMart famously focused on Click and Collect as a way to boost sales during the holiday season last year (2017).

Click and Collect Benefits to Retailers

Investing in Click and Collect creates numerous benefits to retailers.

  • Impulse Sales - Most shoppers who come in purchase additional items.
  • Lower Cost - Shoppers assume delivery costs incurred by retailers when they come in to pickup.

The biggest benefit to retailers are the increased sales Click and Collect generates. According to the same Bell and Howell study, a full 49% of shoppers made unintended purchases while picking up their items in store. Internet Retailing actually put this number higher, saying between 60-75% of Click and Collect shoppers purchase additional products.


A much harder benefit to define is the increased online conversions companies are having by offering Click and Collect fulfillment. What we do know is that both shipping costs, shipping timing, and worries about returns are all major reasons for cart abandonment.


Lastly, Click and Collect eliminates eliminates online returns. Customers are able to experience the product in-store, and make use of existing service centers if they need to return the item.

Lower Your Cart Abandonment Rate Click here to get access to a free PDF field guide that shows you 19 tactics to increase email opt-ins - the most essential step in shopping cart abandonment.

How to Implement a Successful Click and Collect Service

Click and Collect Challenges

Retailers are experiencing a number of challenges implementing Click and Collect.


According to a report by JDA & Centiro, many retailers are failing shopper's expectations.


35% of surveyed shoppers expressed discontent with long waiting times. Worse, 32% said that store associates were unable to locate the products they ordered.


Part of the issues stemmed from stores not having a dedicated pick-up location. 


The truth is...


Click and Collect is going to add tasks to your existing store personnel. And, unfortunately, customers seem to be unwilling to pay for the added convenience of Click and Collect. 


The result? Profit margins are being squeezed from many retailers. 

Keys to Make Click and Collect Succeed

Below are a number of best practices to consider when implementing your Click and Collect service.

  • Connect offline and online customer data
  • Dedicated Pickup Location 
  • Designated Parking Spots
  • Items pre-sorted and ready for pickup
  • Knowledgable store associates
  • Signage within store directing Click and Collect customers

Many of these best practices center on making the service more convenient for shoppers.

Next Steps

While Click and Collect is one method of reducing cart abandonment, there are lower hanging fruit.


Check out our Guide on Cart Abandonment for a broad overview of what your store can do to recover more sales.


If you already have an effective cart abandonment campaign in place, you can multiply results by capturing opt-ins before they reach the check-out. Download our free book on 19 Tactics to Increase Email Subscribers here.

The post [2018 Update] Click and Collect Statistics, Challenges, and Strategies appeared first on Barilliance.

What is a Product Recommendation?

$
0
0

The easiest way to make a sale is through a recommendation.


Unfortunately, many eCommerce store owners slap basic category level or best selling product recommendations on their site and never think about it again.


This is no longer the best we can do.


Today, product recommendation engines are capable of learning about a customer in real-time, and personalizing all pages they interact with - from home to checkout offers.


 This post breaks down how product recommendation engines work, best merchandizing practices, and the results you can get through improving your eCommerce recommendations.

Types of Product Recommendation Engines

How do Product Recommendation Engines Work?

The purpose of product recommendations is twofold: first, to improve the shopping experience, and second to increase revenues.


Product recommendation systems do this by presenting shoppers offers they are most likely to want.


Engines sift through the tens, hundreds, or thousands of items a store carries, and decide which one best suits this particular user.

Generally speaking, there are three broad techniques engines use to filter through SKUs.

1. Collaborative Filtering Technique

Collaberative filtering uses other user’s actions to predict what another user will like.

For example, if one user brosed dresses, but ultimately bought a purse, the software would begin to draw a correlation between these two categories. As more and more users confirmed this association, it would begin influencing which products were being recommended.

2. Content Based Filtering Techniques

Content based filtering focuses on the specific shopper. The product recommendation software tracks a users actions, such as web pages viewed, products clicked on, time spent on various categories, and items added to cart.

Based on this information, a customer profile is created. This profile is then compared to the product catalogue to identify which items to show.

3. Hybrid Recommendations

The best recommendation software actually combines both techniques to give the most accurate prediction. This is how Barilliance works.


By combining both techniques, product recommendation engines are able to apply the "wisdom of the crowd" to prospects before they gather much data. As more information is learned about that particular user, recommendations become more and more personalized based on their session and use history.

Merchandizing Rules

In brick & mortar, stores are forced to choose a single merchandising strategy.

ECommerce stores don’t have this limitation.


Retailers can use personalization technology to create specific merchandizing strategies for any segment of customers. One of the main tools retailers use to accomplish this are product recommendations.


How Merchandizing and Product Recommendations Interact

By default, product recommendation engines work algorithmically. 


However, the best engines allow retailers to "overrule" the software's recommendations in lue of explicit merchandizing rules you set up. 

Exmaples include:


  • Restrict recommendations to only show full priced items ​​
  • Avoid brand conflicts on particular product pages
  • Prioritize transitioning season items
  • Prevent low in stock items from being shown

Retailers define what rules exist, and when these rules are triggered.


Again, using Barilliance as an example, you can determine customer segments that matter to your business. You can then selectively use merchandizing rules on these various segments. 

As you can see, retailers have the capabilitity to define exactly what audience they want to display particular product recommendation widgets for. 


One of the most profitable ways to segment your audience is through a solid RFM analysis. There are six key segments that you can (and should) be creating merchandizing rules for, including:

  • Whales - Customers who have generated the most revenue for your store.
  • Promising - Faithful customers - Customers who return often, but do not spend a lot.
  • Rookies - Your Newest Customers - First time buyers on your site.

By combining merchandising rules and product recommendations, you can create highly targeted offers.

You can promote best selling items to new site visitors, recently viewed items to returning visitors, and related products based on previous purchase to returning customers. 


Product Recommendation Results & Stats

We performed an in-depth study of Barilliance customers who implemented our product recommendation solution.

The results were incredible.

  • Average Attributed Revenue - 12%. We saw, on average, a 12% lift in revenue from our customers after we implemented our hybrid product recommendation solution.
  • Highest Revenue Improvement - 31%. The highest improvement from a customer was a 31% lift in top-line revenue.
  • Increased Conversion Rate550%. Shoppers who interact with our product recommendations were 550% more likely to end their session with a completed purchase.
  • Personalization Effect - Personalized recommendations were 2.2x as effective as generic "best selling" recommendations. 

Next Steps

Improving your product recommendations are the "low hanging fruit" of eCommerce personalization.


We host free demos for our product recommendation solution. If you would like to discover if we could improve your current recommendations with a hybrid, machine learning approach, click here.

The post What is a Product Recommendation? appeared first on Barilliance.

Viewing all 254 articles
Browse latest View live